ARTMARKET COM - Daily - Technical analysis published on 08/06/2024 (GMT)
- 165
- 0
- Timeframe : Daily
- - Analysis generated on
- Status : NEUTRAL

Summary of the analysis

Additional analysis
Quotes
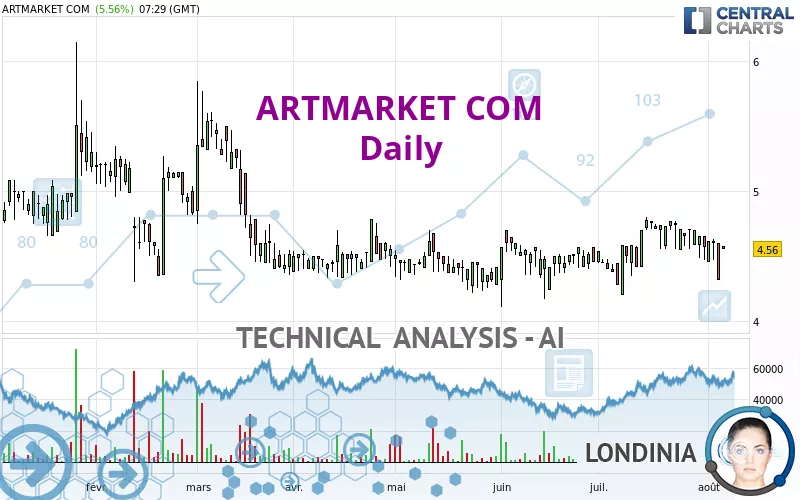
ARTMARKET COM rating 4.56 EUR. On the day, this instrument gained +5.56% and was between 4.56 EUR and 4.58 EUR. This implies that the price is at 0% from its lowest and at -0.44% from its highest.The Central Gaps scanner detects a bullish opening marking the presence of buyers ahead of sellers at the opening but not sufficiently marked to allow the price to register a quotation gap.
Bullish opening
Type : Bullish
Timeframe : Openning
So that you have an overall view of the price change, here is a table showing the variations over several periods:
Near a new LOW record (5 years)
Type : Bearish
Timeframe : Weekly
Near a new HIGH record (1 month)
Type : Bullish
Timeframe : Weekly
Technical
A technical analysis in Daily of this ARTMARKET COM chart shows a slightly bearish trend. Only 57.14% of the signals given by moving averages are bearish. This slightly bearish trend could return to neutral given the neutral signals also given by short-term moving averages. The Central Indicators scanner detects bullish and bearish signals on moving averages that could impact this trend:
Bearish trend reversal : adaptative moving average 50
Type : Bearish
Timeframe : Daily
Bullish price crossover with Moving Average 50
Type : Bullish
Timeframe : Daily
Bullish price crossover with Moving Average 100
Type : Bullish
Timeframe : Daily
Bullish price crossover with adaptative moving average 20
Type : Bullish
Timeframe : Daily
On the 18 technical indicators analysed, 4 are bullish, 5 are neutral and 9 are bearish. Caution: the Central Indicators scanner currently detects an excess:
Previous candle closed under Bollinger bands
Type : Neutral
Timeframe : Daily
Pivot points : price is over resistance 1
Type : Neutral
Timeframe : Daily
Ichimoku : price is over the cloud
Type : Bullish
Timeframe : Daily
Price is back under the pivot point
Type : Bearish
Timeframe : Weekly
Williams %R indicator is back over -50
Type : Bullish
Timeframe : Daily
The Central Patterns scanner, which studies chart patterns, resistances and supports, has identified this signal:
Near resistance of triangle
Type : Bearish
Timeframe : Daily
Central Candlesticks, the scanner specialised in Japanese candlesticks, detects a bullish signal that could support the hypothesis of a small rebound in the very short term:
Bullish harami cross
Type : Bullish
Timeframe : Daily
| S2 | S1 | Price | R1 | R2 | R3 | |
|---|---|---|---|---|---|---|
| ProTrendLines | 2.75 | 4.34 | 4.56 | 4.79 | 5.55 | 5.98 |
| Change (%) | -39.69% | -4.82% | - | +5.04% | +21.71% | +31.14% |
| Change | -1.81 | -0.22 | - | +0.23 | +0.99 | +1.42 |
| Level | Intermediate | Major | - | Intermediate | Minor | Intermediate |
To determine price objectives, it is also possible to use the pivot points. Here is the price position in relation to pivot points:
| Pivot points | S3 | S2 | S1 | PP | R1 | R2 | R3 |
|---|---|---|---|---|---|---|---|
| Standard | 3.95 | 4.13 | 4.23 | 4.41 | 4.51 | 4.69 | 4.79 |
| Camarilla | 4.24 | 4.27 | 4.29 | 4.32 | 4.35 | 4.37 | 4.40 |
| Woodie | 3.90 | 4.11 | 4.18 | 4.39 | 4.46 | 4.67 | 4.74 |
| Fibonacci | 4.13 | 4.24 | 4.31 | 4.41 | 4.52 | 4.59 | 4.69 |
| Pivot points | S3 | S2 | S1 | PP | R1 | R2 | R3 |
|---|---|---|---|---|---|---|---|
| Standard | 4.25 | 4.35 | 4.49 | 4.59 | 4.73 | 4.83 | 4.97 |
| Camarilla | 4.55 | 4.58 | 4.60 | 4.62 | 4.64 | 4.66 | 4.69 |
| Woodie | 4.26 | 4.36 | 4.50 | 4.60 | 4.74 | 4.84 | 4.98 |
| Fibonacci | 4.35 | 4.45 | 4.50 | 4.59 | 4.69 | 4.74 | 4.83 |
| Pivot points | S3 | S2 | S1 | PP | R1 | R2 | R3 |
|---|---|---|---|---|---|---|---|
| Standard | 3.65 | 3.92 | 4.25 | 4.52 | 4.85 | 5.12 | 5.45 |
| Camarilla | 4.41 | 4.46 | 4.52 | 4.57 | 4.63 | 4.68 | 4.74 |
| Woodie | 3.67 | 3.94 | 4.27 | 4.54 | 4.87 | 5.14 | 5.47 |
| Fibonacci | 3.92 | 4.15 | 4.29 | 4.52 | 4.75 | 4.89 | 5.12 |
Numerical data
The following are the details of the technical indicators and moving averages that were collected to generate this technical analysis:
| RSI (14): | 48.27 | |
| MACD (12,26,9): | 0.0000 | |
| Directional Movement: | -11.68 | |
| AROON (14): | -71.43 | |
| DEMA (21): | 4.61 | |
| Parabolic SAR (0,02-0,02-0,2): | 4.71 | |
| Elder Ray (13): | -0.03 | |
| Super Trend (3,10): | 4.30 | |
| Zig ZAG (10): | 4.56 | |
| VORTEX (21): | 0.9800 | |
| Stochastique (14,3,5): | 34.98 | |
| TEMA (21): | 4.58 | |
| Williams %R (14): | -46.67 | |
| Chande Momentum Oscillator (20): | -0.17 | |
| Repulse (5,40,3): | -3.1000 | |
| ROCnROLL: | 2 | |
| TRIX (15,9): | 0.1000 | |
| Courbe Coppock: | 4.56 |
| MA7: | 4.58 | |
| MA20: | 4.65 | |
| MA50: | 4.56 | |
| MA100: | 4.53 | |
| MAexp7: | 4.56 | |
| MAexp20: | 4.60 | |
| MAexp50: | 4.58 | |
| MAexp100: | 4.66 | |
| Price / MA7: | -0.44% | |
| Price / MA20: | -1.94% | |
| Price / MA50: | -0% | |
| Price / MA100: | +0.66% | |
| Price / MAexp7: | -0% | |
| Price / MAexp20: | -0.87% | |
| Price / MAexp50: | -0.44% | |
| Price / MAexp100: | -2.15% |
News
The latest news and videos published on ARTMARKET COM at the time of the analysis were as follows:
- Artmarket.com: CIHA Lyon 2024 - France. Artprice is an active sponsor of the International Congress of Art History (CIHA) which this year will be attended by well over a thousand researchers from over 70 countries (June 23 to 28)
- Artmarket.com: CIHA Lyon 2024 - France. Artprice is an active sponsor of the International Congress of Art History (CIHA) which this year will be attended by well over a thousand researchers from over 70 countries (June 23 to 28)
- Artmarket.com: 2024 Q1 revenue growth… AI with the Intuitive Artmarket® in Artprice databases… New high value-added services and subscriptions
- Artmarket.com: 2024 Q1 revenue growth… AI with the Intuitive Artmarket® in Artprice databases… New high value-added services and subscriptions
- Artmarket.com: 2024 Q1 revenue growth... AI with the Intuitive Artmarket(R) in Artprice databases... New high value-added services and subscriptions
About author
Online


Add a comment
Comments
0 comments on the analysis ARTMARKET COM - Daily