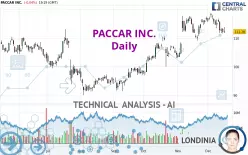
PACCAR INC. - Daily - Technical analysis published on 12/17/2024 (GMT)
- 123
- 0
Click here for a new analysis!
- Timeframe : Daily
- - Analysis generated on
- Status : INVALID

Summary of the analysis

Additional analysis
Quotes
The PACCAR INC. price is 112.28 USD. On the day, this instrument lost -0.05% and was between 111.76 USD and 113.89 USD. This implies that the price is at +0.47% from its lowest and at -1.41% from its highest.A bearish opening was detected by the Central Gaps scanner. Sellers are trying to impose a bearish trend in the very short term.
Bearish opening
Type : Bearish
Timeframe : Openning
Here is a more detailed summary of the historical variations registered by PACCAR INC.:
Near a new HIGH record (1 month)
Type : Bullish
Timeframe : Weekly
Technical
Technical analysis of PACCAR INC. in Daily shows an overall bullish trend. The signals given by moving averages are 75.00% bullish. This bullish trend could slow down given the neutral signals currently being given by short-term moving averages. The Central Indicators scanner detects a bullish signal on moving averages that could impact this trend:
Bullish trend reversal : Moving Average 20
Type : Bullish
Timeframe : Daily
Technical indicators are slightly bearish. There is therefore considerable uncertainty about the continuation of the decline.
But beware of excesses. The Central Indicators scanner currently detects this:
Williams %R indicator is oversold : under -80
Type : Neutral
Timeframe : Daily
Price is back over the pivot point
Type : Bullish
Timeframe : Daily
An analysis of the price chart with the Central Patterns scanner (detector of chart patterns and resistances and supports) shows several results that can have an impact on the price change:
Near horizontal support
Type : Bullish
Timeframe : Daily
Support of channel is broken
Type : Bearish
Timeframe : Daily
The Central Candlesticks scanner which studies Japanese candlesticks did not detect anything.
| S3 | S2 | S1 | Price | R1 | R2 | R3 | |
|---|---|---|---|---|---|---|---|
| ProTrendLines | 99.45 | 103.82 | 109.36 | 112.28 | 114.48 | 118.41 | 123.40 |
| Change (%) | -11.43% | -7.53% | -2.60% | - | +1.96% | +5.46% | +9.90% |
| Change | -12.83 | -8.46 | -2.92 | - | +2.20 | +6.13 | +11.12 |
| Level | Minor | Minor | Major | - | Intermediate | Major | Major |
Attention could also be paid to pivot points to set price objectives:
| Pivot points | S3 | S2 | S1 | PP | R1 | R2 | R3 |
|---|---|---|---|---|---|---|---|
| Standard | 109.66 | 110.64 | 111.49 | 112.47 | 113.32 | 114.30 | 115.15 |
| Camarilla | 111.83 | 112.00 | 112.16 | 112.33 | 112.50 | 112.67 | 112.83 |
| Woodie | 109.59 | 110.61 | 111.42 | 112.44 | 113.25 | 114.27 | 115.08 |
| Fibonacci | 110.64 | 111.34 | 111.77 | 112.47 | 113.17 | 113.60 | 114.30 |
| Pivot points | S3 | S2 | S1 | PP | R1 | R2 | R3 |
|---|---|---|---|---|---|---|---|
| Standard | 105.71 | 108.71 | 110.86 | 113.86 | 116.01 | 119.01 | 121.16 |
| Camarilla | 111.59 | 112.07 | 112.54 | 113.01 | 113.48 | 113.95 | 114.43 |
| Woodie | 105.29 | 108.50 | 110.44 | 113.65 | 115.59 | 118.80 | 120.74 |
| Fibonacci | 108.71 | 110.68 | 111.89 | 113.86 | 115.83 | 117.04 | 119.01 |
| Pivot points | S3 | S2 | S1 | PP | R1 | R2 | R3 |
|---|---|---|---|---|---|---|---|
| Standard | 92.23 | 97.45 | 107.23 | 112.45 | 122.23 | 127.45 | 137.23 |
| Camarilla | 112.88 | 114.25 | 115.63 | 117.00 | 118.38 | 119.75 | 121.13 |
| Woodie | 94.50 | 98.59 | 109.50 | 113.59 | 124.50 | 128.59 | 139.50 |
| Fibonacci | 97.45 | 103.18 | 106.72 | 112.45 | 118.18 | 121.72 | 127.45 |
Numerical data
The following are the details of the technical indicators and moving averages that were collected to generate this technical analysis:
| RSI (14): | 46.76 | |
| MACD (12,26,9): | 0.6600 | |
| Directional Movement: | -7.01 | |
| AROON (14): | -57.15 | |
| DEMA (21): | 115.42 | |
| Parabolic SAR (0,02-0,02-0,2): | 118.25 | |
| Elder Ray (13): | -1.39 | |
| Super Trend (3,10): | 111.71 | |
| Zig ZAG (10): | 112.39 | |
| VORTEX (21): | 0.9300 | |
| Stochastique (14,3,5): | 12.74 | |
| TEMA (21): | 113.93 | |
| Williams %R (14): | -90.39 | |
| Chande Momentum Oscillator (20): | -4.68 | |
| Repulse (5,40,3): | -1.8100 | |
| ROCnROLL: | -1 | |
| TRIX (15,9): | 0.2000 | |
| Courbe Coppock: | 1.36 |
| MA7: | 113.78 | |
| MA20: | 114.82 | |
| MA50: | 110.92 | |
| MA100: | 103.33 | |
| MAexp7: | 113.61 | |
| MAexp20: | 114.03 | |
| MAexp50: | 110.84 | |
| MAexp100: | 107.42 | |
| Price / MA7: | -1.32% | |
| Price / MA20: | -2.21% | |
| Price / MA50: | +1.23% | |
| Price / MA100: | +8.66% | |
| Price / MAexp7: | -1.17% | |
| Price / MAexp20: | -1.53% | |
| Price / MAexp50: | +1.30% | |
| Price / MAexp100: | +4.52% |
News
The latest news and videos published on PACCAR INC. at the time of the analysis were as follows:
- PACCAR Declares Regular Quarterly Cash Dividend
- PACCAR Achieves Excellent Financial Performance
- PACCAR and Platform Science Announce Strategic Equity Investment
- PACCAR Recognizes Top Performing Suppliers in North America
- PACCAR Recognizes 10 PPM Quality Award Winners
About author
Online


Add a comment
Comments
0 comments on the analysis PACCAR INC. - Daily