| Open: | 1,910 |
| Change: | 0 |
| Volume: | 2,051 |
| Low: | 1,900 |
| High: | 2,000 |
| High / Low range: | 100 |
| Type: | Stocks |
| Ticker: | OI |
| ISIN: |
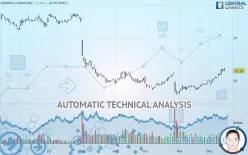
O-I GLASS INC. - Daily - Technical analysis published on 12/17/2019 (GMT)
- 245
- 0
- 12/17/2019 - 13:07
- Who voted?
Click here for a new analysis!
- Timeframe : Daily
- - Analysis generated on 12/17/2019 - 13:05
- Status : TARGET REACHED

Summary of the analysis

Additional analysis
Quotes
The OWENS-ILLINOIS INC. price is 11.14 USD. On the day, this instrument gained +0.36% with the lowest point at 11.10 USD and the highest point at 11.52 USD. The deviation from the price is +0.36% for the low point and -3.30% for the high point.A bullish opening was detected by the Central Gaps scanner. Buyers are trying to impose a bullish momentum in the very short term.
Bullish opening
Type : Bullish
Timeframe : Openning
A study of price movements over other periods shows the following variations:
Technical
A technical analysis in Daily of this OWENS-ILLINOIS INC. chart shows a bullish trend. The signals returned by the moving averages are 67.86% bullish. This bullish trend is reinforced by the strong signals currently being given by short-term moving averages. There is no crossing of moving average by the price or crossing of moving averages between themselves.
Technical indicators are strongly bullish, suggesting that the price increase should continue.
But beware of excesses. The Central Indicators scanner currently detects this:
RSI indicator is overbought : over 70
Type : Neutral
Timeframe : Daily
CCI indicator is overbought : over 100
Type : Neutral
Timeframe : Daily
Previous candle closed over Bollinger bands
Type : Neutral
Timeframe : Daily
Williams %R indicator is overbought : over -20
Type : Neutral
Timeframe : Daily
Price is back over the pivot point
Type : Bullish
Timeframe : Weekly
Price is back under the pivot point
Type : Bearish
Timeframe : Daily
Central Patterns, the scanner specializing in chart patterns, did not identify any signals.
The Central Candlesticks scanner which studies Japanese candlesticks did not detect anything.
| S2 | S1 | Price | R1 | R2 | R3 | |
|---|---|---|---|---|---|---|
| ProTrendLines | 9.73 | 10.90 | 11.14 | 14.09 | 15.72 | 17.70 |
| Change (%) | -12.66% | -2.15% | - | +26.48% | +41.11% | +58.89% |
| Change | -1.41 | -0.24 | - | +2.95 | +4.58 | +6.56 |
| Level | Major | Major | - | Minor | Intermediate | Intermediate |
To determine price objectives, it is also possible to use the pivot points. Here is the price position in relation to pivot points:
| Pivot points | S3 | S2 | S1 | PP | R1 | R2 | R3 |
|---|---|---|---|---|---|---|---|
| Standard | 10.62 | 10.81 | 10.96 | 11.15 | 11.30 | 11.49 | 11.64 |
| Camarilla | 11.01 | 11.04 | 11.07 | 11.10 | 11.13 | 11.16 | 11.19 |
| Woodie | 10.59 | 10.80 | 10.93 | 11.14 | 11.27 | 11.48 | 11.61 |
| Fibonacci | 10.81 | 10.94 | 11.02 | 11.15 | 11.28 | 11.36 | 11.49 |
| Pivot points | S3 | S2 | S1 | PP | R1 | R2 | R3 |
|---|---|---|---|---|---|---|---|
| Standard | 9.35 | 9.80 | 10.45 | 10.90 | 11.55 | 12.00 | 12.65 |
| Camarilla | 10.80 | 10.90 | 11.00 | 11.10 | 11.20 | 11.30 | 11.40 |
| Woodie | 9.45 | 9.85 | 10.55 | 10.95 | 11.65 | 12.05 | 12.75 |
| Fibonacci | 9.80 | 10.22 | 10.48 | 10.90 | 11.32 | 11.58 | 12.00 |
| Pivot points | S3 | S2 | S1 | PP | R1 | R2 | R3 |
|---|---|---|---|---|---|---|---|
| Standard | 7.13 | 7.73 | 8.80 | 9.40 | 10.47 | 11.07 | 12.14 |
| Camarilla | 9.41 | 9.56 | 9.72 | 9.87 | 10.02 | 10.18 | 10.33 |
| Woodie | 7.36 | 7.84 | 9.03 | 9.52 | 10.71 | 11.19 | 12.38 |
| Fibonacci | 7.73 | 8.37 | 8.76 | 9.40 | 10.04 | 10.43 | 11.07 |
Numerical data
The following is the status of technical indicators and moving averages registered at the time this technical analysis was created:
| RSI (14): | 70.96 | |
| MACD (12,26,9): | 0.4300 | |
| Directional Movement: | 28.41 | |
| AROON (14): | 100.00 | |
| DEMA (21): | 10.70 | |
| Parabolic SAR (0,02-0,02-0,2): | 10.55 | |
| Elder Ray (13): | 0.84 | |
| Super Trend (3,10): | 10.23 | |
| Zig ZAG (10): | 11.14 | |
| VORTEX (21): | 1.2300 | |
| Stochastique (14,3,5): | 88.58 | |
| TEMA (21): | 11.11 | |
| Williams %R (14): | -17.72 | |
| Chande Momentum Oscillator (20): | 1.48 | |
| Repulse (5,40,3): | -1.4200 | |
| ROCnROLL: | 1 | |
| TRIX (15,9): | 0.4300 | |
| Courbe Coppock: | 30.28 |
| MA7: | 10.79 | |
| MA20: | 9.98 | |
| MA50: | 9.62 | |
| MA100: | 10.30 | |
| MAexp7: | 10.81 | |
| MAexp20: | 10.21 | |
| MAexp50: | 10.04 | |
| MAexp100: | 10.97 | |
| Price / MA7: | +3.24% | |
| Price / MA20: | +11.62% | |
| Price / MA50: | +15.80% | |
| Price / MA100: | +8.16% | |
| Price / MAexp7: | +3.05% | |
| Price / MAexp20: | +9.11% | |
| Price / MAexp50: | +10.96% | |
| Price / MAexp100: | +1.55% |
News
Don"t forget to follow the news on OWENS-ILLINOIS INC.. At the time of publication of this analysis, the latest news was as follows:
- 02/07/2018 - 06:45 Owens-Illinois, Inc. to Host Earnings Call
- 10/24/2017 - 06:25 Owens-Illinois, Inc. to Host Earnings Call
-
02/11/2017 - 05:59
 Owens-Illinois
-
05/13/2015 - 22:19
Shares of Owens-Illinois Spike After Announcing Acquisition of Vitro
-
03/21/2012 - 14:00
Cramer Interviews Owens-Illinois CEO
About author

Online


Add a comment
Comments
0 comments on the analysis O-I GLASS INC. - Daily