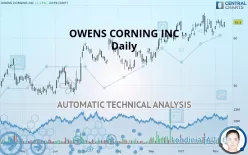
OWENS CORNING INC - Daily - Technical analysis published on 11/12/2019 (GMT)
- 267
- 0
- Who voted?
Click here for a new analysis!
- Timeframe : Daily
- - Analysis generated on
- Status : TARGET REACHED

Summary of the analysis

Additional analysis
Quotes
The OWENS CORNING INC price is 63.30 USD. On the day, this instrument gained +1.13% with the lowest point at 62.22 USD and the highest point at 63.39 USD. The deviation from the price is +1.74% for the low point and -0.14% for the high point.A bullish opening was detected by the Central Gaps scanner. Buyers are trying to impose a bullish momentum in the very short term.
Bullish opening
Type : Bullish
Timeframe : Openning
Here is a more detailed summary of the historical variations registered by OWENS CORNING INC:
Near a new HIGH record (1 year)
Type : Bullish
Timeframe : Weekly
Near a new HIGH record (1st january)
Type : Bullish
Timeframe : Weekly
Technical
A technical analysis in Daily of this OWENS CORNING INC chart shows a strongly bullish trend. The signals given by the moving averages are 92.86% bullish. This strong bullish trend is confirmed by the strong signals currently being given by short-term moving averages. There is no crossing of moving average by the price or crossing of moving averages between themselves.
In fact, 10 technical indicators on 18 studied are currently positioned bullish. But beware of excesses. The Central Indicators scanner currently detects this:
Williams %R indicator is overbought : over -20
Type : Neutral
Timeframe : Daily
Pivot points : price is over resistance 2
Type : Neutral
Timeframe : Daily
Price is back under the pivot point
Type : Bearish
Timeframe : Weekly
Momentum indicator is back over 0
Type : Bullish
Timeframe : Daily
Central Patterns, the market scanner focusing on chart patterns, resistances and supports found these results:
Near horizontal resistance
Type : Bearish
Timeframe : Daily
Near resistance of triangle
Type : Bearish
Timeframe : Daily
Central Candlesticks, the scanner specialised in Japanese candlesticks, detects these signals that could have an impact on the current short-term trend:
Bullish harami
Type : Bullish
Timeframe : Daily
Doji
Type : Neutral
Timeframe : Daily
| S3 | S2 | S1 | Price | R1 | R2 | R3 | |
|---|---|---|---|---|---|---|---|
| ProTrendLines | 48.37 | 55.62 | 59.45 | 63.30 | 63.35 | 67.15 | 77.61 |
| Change (%) | -23.59% | -12.13% | -6.08% | - | +0.08% | +6.08% | +22.61% |
| Change | -14.93 | -7.68 | -3.85 | - | +0.05 | +3.85 | +14.31 |
| Level | Minor | Major | Major | - | Major | Minor | Minor |
Attention could also be paid to pivot points to set price objectives:
| Pivot points | S3 | S2 | S1 | PP | R1 | R2 | R3 |
|---|---|---|---|---|---|---|---|
| Standard | 61.80 | 62.02 | 62.31 | 62.53 | 62.82 | 63.04 | 63.33 |
| Camarilla | 62.45 | 62.50 | 62.54 | 62.59 | 62.64 | 62.68 | 62.73 |
| Woodie | 61.83 | 62.04 | 62.34 | 62.55 | 62.85 | 63.06 | 63.36 |
| Fibonacci | 62.02 | 62.22 | 62.34 | 62.53 | 62.73 | 62.85 | 63.04 |
| Pivot points | S3 | S2 | S1 | PP | R1 | R2 | R3 |
|---|---|---|---|---|---|---|---|
| Standard | 60.11 | 61.14 | 61.86 | 62.89 | 63.61 | 64.64 | 65.36 |
| Camarilla | 62.11 | 62.27 | 62.43 | 62.59 | 62.75 | 62.91 | 63.07 |
| Woodie | 59.97 | 61.06 | 61.72 | 62.81 | 63.47 | 64.56 | 65.22 |
| Fibonacci | 61.14 | 61.81 | 62.22 | 62.89 | 63.56 | 63.97 | 64.64 |
| Pivot points | S3 | S2 | S1 | PP | R1 | R2 | R3 |
|---|---|---|---|---|---|---|---|
| Standard | 52.29 | 55.66 | 58.47 | 61.85 | 64.66 | 68.03 | 70.84 |
| Camarilla | 59.58 | 60.15 | 60.71 | 61.28 | 61.85 | 62.41 | 62.98 |
| Woodie | 52.00 | 55.52 | 58.19 | 61.70 | 64.37 | 67.89 | 70.56 |
| Fibonacci | 55.66 | 58.02 | 59.48 | 61.85 | 64.21 | 65.67 | 68.03 |
Numerical data
The following is the status of technical indicators and moving averages registered at the time this technical analysis was created:
| RSI (14): | 57.88 | |
| MACD (12,26,9): | 0.5800 | |
| Directional Movement: | 10.14 | |
| AROON (14): | -35.72 | |
| DEMA (21): | 63.19 | |
| Parabolic SAR (0,02-0,02-0,2): | 64.51 | |
| Elder Ray (13): | 0.19 | |
| Super Trend (3,10): | 59.96 | |
| Zig ZAG (10): | 63.30 | |
| VORTEX (21): | 0.9700 | |
| Stochastique (14,3,5): | 49.09 | |
| TEMA (21): | 62.97 | |
| Williams %R (14): | -40.51 | |
| Chande Momentum Oscillator (20): | 1.61 | |
| Repulse (5,40,3): | 1.0500 | |
| ROCnROLL: | 1 | |
| TRIX (15,9): | 0.1500 | |
| Courbe Coppock: | 0.66 |
| MA7: | 62.97 | |
| MA20: | 62.61 | |
| MA50: | 60.90 | |
| MA100: | 58.27 | |
| MAexp7: | 62.83 | |
| MAexp20: | 62.35 | |
| MAexp50: | 60.81 | |
| MAexp100: | 58.43 | |
| Price / MA7: | +0.52% | |
| Price / MA20: | +1.10% | |
| Price / MA50: | +3.94% | |
| Price / MA100: | +8.63% | |
| Price / MAexp7: | +0.75% | |
| Price / MAexp20: | +1.52% | |
| Price / MAexp50: | +4.09% | |
| Price / MAexp100: | +8.33% |
News
Don"t forget to follow the news on OWENS CORNING INC. At the time of publication of this analysis, the latest news was as follows:
- Owens Corning Announces CFO Transition
- Owens Corning Announces Ambitious 2030 Sustainability Goals
- Owens Corning Names “Pacific Wave” 2020 Shingle Color of the Year
- Owens Corning to Announce Third-Quarter 2019 Financial Results on Oct. 23
- Owens Corning Elects Eduardo Cordeiro to Board of Directors
About author

Online


Add a comment
Comments
0 comments on the analysis OWENS CORNING INC - Daily