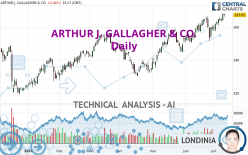
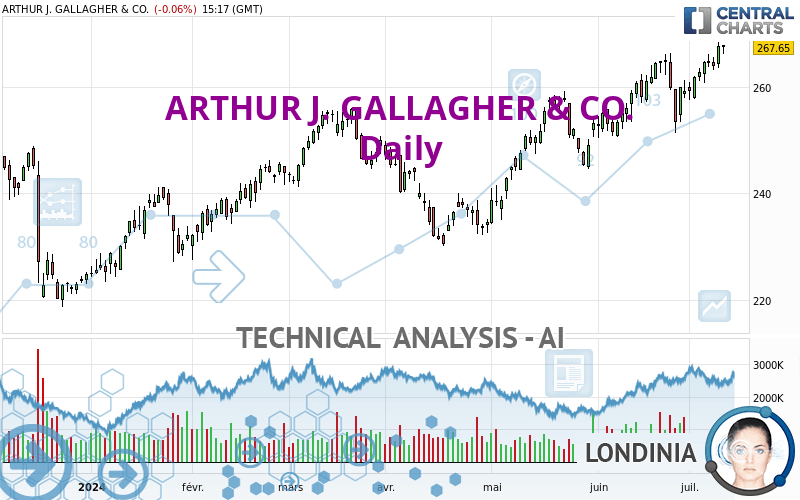
ARTHUR J. GALLAGHER & CO. - Daily - Technical analysis published on 07/11/2024 (GMT)
- 112
- 0
Click here for a new analysis!
- Timeframe : Daily
- - Analysis generated on
- Status : TARGET REACHED
Summary of the analysis

Additional analysis
Quotes
The ARTHUR J. GALLAGHER & CO. rating is 267.65 USD. The price is lower by -0.06% since the last closing and was traded between 266.17 USD and 267.94 USD over the period. The price is currently at +0.56% from its lowest and -0.11% from its highest.The Central Gaps scanner detects a bullish opening. A small advantage for buyers in the very short term.
Bullish opening
Type : Bullish
Timeframe : Openning
So that you have an overall view of the price change, here is a table showing the variations over several periods:
New HIGH record (5 years)
Type : Bullish
Timeframe : Weekly
Near a new HIGH record (1 year)
Type : Bullish
Timeframe : Weekly
Near a new HIGH record (1st january)
Type : Bullish
Timeframe : Weekly
Near a new HIGH record (1 month)
Type : Bullish
Timeframe : Weekly
Technical
Technical analysis of this Daily chart of ARTHUR J. GALLAGHER & CO. indicates that the overall trend is strongly bullish. 92.86% of the signals given by moving averages are bullish. The overall trend is supported by the strong bullish signals from short-term moving averages. The Central Indicators scanner does not detect any result on moving averages that would impact this trend.
The probability of a further increase is high given the direction of the technical indicators.
Caution: the Central Indicators scanner currently detects an excess:
CCI indicator is overbought : over 100
Type : Neutral
Timeframe : Daily
RSI indicator: bearish divergence
Type : Bearish
Timeframe : Daily
Williams %R indicator is overbought : over -20
Type : Neutral
Timeframe : Daily
Price is back under the pivot point
Type : Bearish
Timeframe : Daily
An analysis of the price chart with the Central Patterns scanner (detector of chart patterns and resistances and supports) shows several results that can have an impact on the price change:
Near resistance of channel
Type : Bearish
Timeframe : Daily
Near horizontal support
Type : Bullish
Timeframe : Daily
No result was found by the Central Candlesticks scanner on Japanese candlesticks.
| S3 | S2 | S1 | Price | |
|---|---|---|---|---|
| ProTrendLines | 238.76 | 251.02 | 265.19 | 267.65 |
| Change (%) | -10.79% | -6.21% | -0.92% | - |
| Change | -28.89 | -16.63 | -2.46 | - |
| Level | Minor | Major | Major | - |
Attention could also be paid to pivot points to set price objectives:
| Pivot points | S3 | S2 | S1 | PP | R1 | R2 | R3 |
|---|---|---|---|---|---|---|---|
| Standard | 259.77 | 261.67 | 264.73 | 266.63 | 269.69 | 271.59 | 274.65 |
| Camarilla | 266.44 | 266.89 | 267.35 | 267.80 | 268.26 | 268.71 | 269.16 |
| Woodie | 260.36 | 261.96 | 265.32 | 266.92 | 270.28 | 271.88 | 275.24 |
| Fibonacci | 261.67 | 263.56 | 264.73 | 266.63 | 268.52 | 269.69 | 271.59 |
| Pivot points | S3 | S2 | S1 | PP | R1 | R2 | R3 |
|---|---|---|---|---|---|---|---|
| Standard | 252.41 | 255.00 | 259.83 | 262.42 | 267.25 | 269.84 | 274.67 |
| Camarilla | 262.63 | 263.31 | 263.99 | 264.67 | 265.35 | 266.03 | 266.71 |
| Woodie | 253.54 | 255.56 | 260.96 | 262.98 | 268.38 | 270.40 | 275.80 |
| Fibonacci | 255.00 | 257.83 | 259.58 | 262.42 | 265.25 | 267.00 | 269.84 |
| Pivot points | S3 | S2 | S1 | PP | R1 | R2 | R3 |
|---|---|---|---|---|---|---|---|
| Standard | 234.20 | 242.06 | 250.68 | 258.54 | 267.16 | 275.02 | 283.64 |
| Camarilla | 254.78 | 256.29 | 257.80 | 259.31 | 260.82 | 262.33 | 263.84 |
| Woodie | 234.59 | 242.25 | 251.07 | 258.73 | 267.55 | 275.21 | 284.03 |
| Fibonacci | 242.06 | 248.35 | 252.24 | 258.54 | 264.83 | 268.72 | 275.02 |
Numerical data
The following is the status of the technical indicators and moving averages at the time of publication of this technical analysis:
| RSI (14): | 62.18 | |
| MACD (12,26,9): | 3.2200 | |
| Directional Movement: | 10.65 | |
| AROON (14): | 64.29 | |
| DEMA (21): | 265.73 | |
| Parabolic SAR (0,02-0,02-0,2): | 253.77 | |
| Elder Ray (13): | 4.00 | |
| Super Trend (3,10): | 255.61 | |
| Zig ZAG (10): | 266.45 | |
| VORTEX (21): | 1.1600 | |
| Stochastique (14,3,5): | 89.08 | |
| TEMA (21): | 266.05 | |
| Williams %R (14): | -12.11 | |
| Chande Momentum Oscillator (20): | 1.25 | |
| Repulse (5,40,3): | 0.6900 | |
| ROCnROLL: | 1 | |
| TRIX (15,9): | 0.1700 | |
| Courbe Coppock: | 2.55 |
| MA7: | 264.64 | |
| MA20: | 261.98 | |
| MA50: | 254.40 | |
| MA100: | 248.81 | |
| MAexp7: | 264.72 | |
| MAexp20: | 261.43 | |
| MAexp50: | 255.65 | |
| MAexp100: | 249.65 | |
| Price / MA7: | +1.14% | |
| Price / MA20: | +2.16% | |
| Price / MA50: | +5.21% | |
| Price / MA100: | +7.57% | |
| Price / MAexp7: | +1.11% | |
| Price / MAexp20: | +2.38% | |
| Price / MAexp50: | +4.69% | |
| Price / MAexp100: | +7.21% |
News
The latest news and videos published on ARTHUR J. GALLAGHER & CO. at the time of the analysis were as follows:
- Arthur J. Gallagher & Co. Announces Second Quarter 2024 Earnings Release And Conference Call Date
- Arthur J. Gallagher & Co. Acquires Cleary Benefits Group Inc.
- Arthur J. Gallagher & Co. Acquires NetClaim
- Arthur J. Gallagher & Co. Acquires Cornerstone Commercial & Personal Insurance Services, Inc.
- Arthur J. Gallagher & Co. Acquires Zayla Partners, LLC
About author
Online


Add a comment
Comments
0 comments on the analysis ARTHUR J. GALLAGHER & CO. - Daily