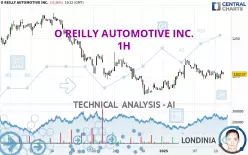
O REILLY AUTOMOTIVE INC. - 1H - Technical analysis published on 01/10/2025 (GMT)
- 80
- 0
Click here for a new analysis!
- Timeframe : 1H
- - Analysis generated on
- Status : TARGET REACHED

Summary of the analysis

Additional analysis
Quotes
The O REILLY AUTOMOTIVE INC. price is 1,202.57 USD. On the day, this instrument lost -0.26% and was traded between 1,195.36 USD and 1,207.95 USD over the period. The price is currently at +0.60% from its lowest and -0.45% from its highest.The Central Gaps scanner detects a bearish gap which is a sign that the sellers have taken the lead in the very short term.
Opening Gap DOWN
Type : Bearish
Timeframe : Openning
So that you have an overall view of the price change, here is a table showing the variations over several periods:
Near a new HIGH record (5 years)
Type : Bullish
Timeframe : Weekly
Near a new HIGH record (1st january)
Type : Bullish
Timeframe : Weekly
Near a new LOW record (1 month)
Type : Bearish
Timeframe : Weekly
Technical
A technical analysis in 1H of this O REILLY AUTOMOTIVE INC. chart shows a bearish trend. 64.29% of the signals given by moving averages are bearish. Caution: the neutral signals currently given by short-term moving averages show us that the global trend is losing momentum. The Central Indicators market scanner is currently detecting several bearish and bullish signals that could impact this trend:
Bullish price crossover with Moving Average 20
Type : Bullish
Timeframe : 1 hour
Bearish price crossover with Moving Average 100
Type : Bearish
Timeframe : 1 hour
An assessment of technical indicators does not currently provide any relevant information on the direction of future price movements.
Other results related to technical indicators were also found by the Central Indicators scanner:
RSI indicator is back under 50
Type : Bearish
Timeframe : 1 hour
Price is back over the pivot point
Type : Bullish
Timeframe : 1 hour
An analysis of the price chart with the Central Patterns scanner (detector of chart patterns and resistances and supports) shows several results that can have an impact on the price change:
Near horizontal resistance
Type : Bearish
Timeframe : 1 hour
Resistance of channel is broken
Type : Bullish
Timeframe : 1 hour
The presence of a bearish pattern in Japanese candlesticks detected by Central Candlesticks that could cause a correction in the very short term was also detected:
Bearish harami
Type : Bearish
Timeframe : 1 hour
| S3 | S2 | S1 | Price | R1 | R2 | R3 | |
|---|---|---|---|---|---|---|---|
| ProTrendLines | 1,140.03 | 1,167.53 | 1,195.46 | 1,202.57 | 1,219.89 | 1,240.25 | 1,254.80 |
| Change (%) | -5.20% | -2.91% | -0.59% | - | +1.44% | +3.13% | +4.34% |
| Change | -62.54 | -35.04 | -7.11 | - | +17.32 | +37.68 | +52.23 |
| Level | Major | Major | Intermediate | - | Intermediate | Minor | Intermediate |
To determine price objectives, it is also possible to use the pivot points. Here is the price position in relation to pivot points:
| Pivot points | S3 | S2 | S1 | PP | R1 | R2 | R3 |
|---|---|---|---|---|---|---|---|
| Standard | 1,185.20 | 1,190.67 | 1,198.21 | 1,203.68 | 1,211.22 | 1,216.69 | 1,224.23 |
| Camarilla | 1,202.16 | 1,203.36 | 1,204.55 | 1,205.74 | 1,206.93 | 1,208.13 | 1,209.32 |
| Woodie | 1,186.23 | 1,191.19 | 1,199.24 | 1,204.20 | 1,212.25 | 1,217.21 | 1,225.26 |
| Fibonacci | 1,190.67 | 1,195.64 | 1,198.71 | 1,203.68 | 1,208.65 | 1,211.72 | 1,216.69 |
| Pivot points | S3 | S2 | S1 | PP | R1 | R2 | R3 |
|---|---|---|---|---|---|---|---|
| Standard | 1,146.86 | 1,160.68 | 1,182.45 | 1,196.27 | 1,218.04 | 1,231.86 | 1,253.63 |
| Camarilla | 1,194.43 | 1,197.70 | 1,200.96 | 1,204.22 | 1,207.48 | 1,210.75 | 1,214.01 |
| Woodie | 1,150.84 | 1,162.67 | 1,186.43 | 1,198.26 | 1,222.02 | 1,233.85 | 1,257.61 |
| Fibonacci | 1,160.68 | 1,174.28 | 1,182.68 | 1,196.27 | 1,209.87 | 1,218.27 | 1,231.86 |
| Pivot points | S3 | S2 | S1 | PP | R1 | R2 | R3 |
|---|---|---|---|---|---|---|---|
| Standard | 1,036.09 | 1,105.29 | 1,145.55 | 1,214.75 | 1,255.01 | 1,324.21 | 1,364.47 |
| Camarilla | 1,155.70 | 1,165.73 | 1,175.77 | 1,185.80 | 1,195.83 | 1,205.87 | 1,215.90 |
| Woodie | 1,021.61 | 1,098.06 | 1,131.07 | 1,207.52 | 1,240.53 | 1,316.98 | 1,349.99 |
| Fibonacci | 1,105.29 | 1,147.11 | 1,172.94 | 1,214.75 | 1,256.57 | 1,282.40 | 1,324.21 |
Numerical data
The following are the details of the technical indicators and moving averages that were collected to generate this technical analysis:
| RSI (14): | 52.18 | |
| MACD (12,26,9): | 0.1100 | |
| Directional Movement: | -1.85 | |
| AROON (14): | -50.00 | |
| DEMA (21): | 1,204.24 | |
| Parabolic SAR (0,02-0,02-0,2): | 1,195.36 | |
| Elder Ray (13): | 2.90 | |
| Super Trend (3,10): | 1,197.38 | |
| Zig ZAG (10): | 1,204.56 | |
| VORTEX (21): | 0.9000 | |
| Stochastique (14,3,5): | 63.70 | |
| TEMA (21): | 1,203.09 | |
| Williams %R (14): | -44.89 | |
| Chande Momentum Oscillator (20): | 5.05 | |
| Repulse (5,40,3): | 0.4700 | |
| ROCnROLL: | 2 | |
| TRIX (15,9): | 0.0100 | |
| Courbe Coppock: | 0.36 |
| MA7: | 1,199.50 | |
| MA20: | 1,219.87 | |
| MA50: | 1,218.46 | |
| MA100: | 1,185.15 | |
| MAexp7: | 1,203.31 | |
| MAexp20: | 1,203.81 | |
| MAexp50: | 1,203.92 | |
| MAexp100: | 1,209.92 | |
| Price / MA7: | +0.26% | |
| Price / MA20: | -1.42% | |
| Price / MA50: | -1.30% | |
| Price / MA100: | +1.47% | |
| Price / MAexp7: | -0.06% | |
| Price / MAexp20: | -0.10% | |
| Price / MAexp50: | -0.11% | |
| Price / MAexp100: | -0.61% |
News
Don't forget to follow the news on O REILLY AUTOMOTIVE INC.. At the time of publication of this analysis, the latest news was as follows:
- O’Reilly Auto Parts Expands Domo Relationship with Five-Year Enterprise License Agreement
- EcoChain, Inc. Appoints Mary O’Reilly as Chief People Officer
- BAI Communications appoints Brendan O'Reilly as Global Chief Technology Officer
- Investor Alert: Ademi & O'Reilly, LLP Investigates Possible Securities Fraud of Iqiyi Inc.
- Investor Alert: Ademi & O'Reilly, LLP Investigates Possible Securities Fraud of Vaxart, Inc.
About author
Online


Add a comment
Comments
0 comments on the analysis O REILLY AUTOMOTIVE INC. - 1H