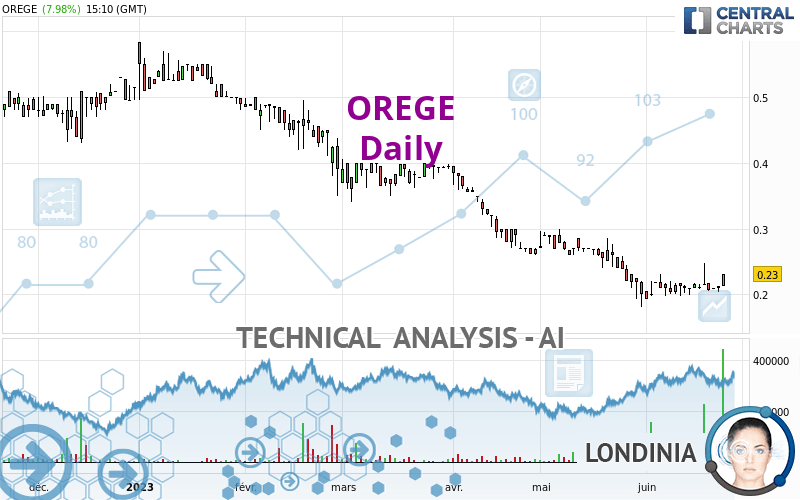
OREGE - Daily - Technical analysis published on 06/23/2023 (GMT)
- 130
- 0
Click here for a new analysis!
- Timeframe : Daily
- - Analysis generated on
- Status : INVALID

Summary of the analysis

Additional analysis
Quotes
The OREGE price is 0.2300 EUR. The price has increased by +7.98% since the last closing and was traded between 0.2120 EUR and 0.2300 EUR over the period. The price is currently at +8.49% from its lowest and 0% from its highest.A study of price movements over other periods shows the following variations:
Abnormal volumes
Timeframe : 5 days
Abnormal volumes
Timeframe : 20 days
Abnormal volumes
Timeframe : 50 days
Technical
Technical analysis of OREGE in Daily shows an overall bearish trend. The signals given by moving averages are 71.43% bearish. This bearish trend could slow down given the neutral signals currently being given by short-term moving averages. The Central Indicators scanner detects bullish signals on moving averages that could impact this trend:
Bullish price crossover with adaptative moving average 20
Type : Bullish
Timeframe : Daily
Bullish price crossover with adaptative moving average 50
Type : Bullish
Timeframe : Daily
The technical indicators are bullish. There is still some doubt about the price increase.
Caution: the Central Indicators scanner currently detects an excess:
CCI indicator is overbought : over 100
Type : Neutral
Timeframe : Daily
Pivot points : price is over resistance 2
Type : Neutral
Timeframe : Weekly
Pivot points : price is over resistance 3
Type : Neutral
Timeframe : Daily
RSI indicator is back over 50
Type : Bullish
Timeframe : Daily
Williams %R indicator is back over -50
Type : Bullish
Timeframe : Daily
The Central Patterns scanner, which studies chart patterns, resistances and supports, has identified these signals:
Near resistance of channel
Type : Bearish
Timeframe : Daily
Horizontal resistance is broken
Type : Bullish
Timeframe : Daily
No result was found by the Central Candlesticks scanner on Japanese candlesticks.
| S1 | Price | R1 | R2 | R3 | |
|---|---|---|---|---|---|
| ProTrendLines | 0.2136 | 0.2300 | 0.4436 | 0.5500 | 0.6891 |
| Change (%) | -7.13% | - | +92.87% | +139.13% | +199.61% |
| Change | -0.0164 | - | +0.2136 | +0.3200 | +0.4591 |
| Level | Minor | - | Intermediate | Major | Intermediate |
To determine price objectives, it is also possible to use the pivot points. Here is the price position in relation to pivot points:
| Pivot points | S3 | S2 | S1 | PP | R1 | R2 | R3 |
|---|---|---|---|---|---|---|---|
| Standard | 0.1963 | 0.1997 | 0.2063 | 0.2097 | 0.2163 | 0.2197 | 0.2263 |
| Camarilla | 0.2103 | 0.2112 | 0.2121 | 0.2130 | 0.2139 | 0.2148 | 0.2158 |
| Woodie | 0.1980 | 0.2005 | 0.2080 | 0.2105 | 0.2180 | 0.2205 | 0.2280 |
| Fibonacci | 0.1997 | 0.2035 | 0.2059 | 0.2097 | 0.2135 | 0.2159 | 0.2197 |
| Pivot points | S3 | S2 | S1 | PP | R1 | R2 | R3 |
|---|---|---|---|---|---|---|---|
| Standard | 0.1790 | 0.1880 | 0.1990 | 0.2080 | 0.2190 | 0.2280 | 0.2390 |
| Camarilla | 0.2045 | 0.2063 | 0.2082 | 0.2100 | 0.2118 | 0.2137 | 0.2155 |
| Woodie | 0.1800 | 0.1885 | 0.2000 | 0.2085 | 0.2200 | 0.2285 | 0.2400 |
| Fibonacci | 0.1880 | 0.1956 | 0.2004 | 0.2080 | 0.2156 | 0.2204 | 0.2280 |
| Pivot points | S3 | S2 | S1 | PP | R1 | R2 | R3 |
|---|---|---|---|---|---|---|---|
| Standard | 0.0342 | 0.1073 | 0.1537 | 0.2268 | 0.2732 | 0.3463 | 0.3927 |
| Camarilla | 0.1671 | 0.1781 | 0.1891 | 0.2000 | 0.2110 | 0.2219 | 0.2329 |
| Woodie | 0.0208 | 0.1006 | 0.1403 | 0.2201 | 0.2598 | 0.3396 | 0.3793 |
| Fibonacci | 0.1073 | 0.1530 | 0.1812 | 0.2268 | 0.2725 | 0.3007 | 0.3463 |
Numerical data
The following are the details of the technical indicators and moving averages that were collected to generate this technical analysis:
| RSI (14): | 51.82 | |
| MACD (12,26,9): | -0.0102 | |
| Directional Movement: | 4.8722 | |
| AROON (14): | 35.7143 | |
| DEMA (21): | 0.2031 | |
| Parabolic SAR (0,02-0,02-0,2): | 0.1978 | |
| Elder Ray (13): | 0.0054 | |
| Super Trend (3,10): | 0.2560 | |
| Zig ZAG (10): | 0.2300 | |
| VORTEX (21): | 0.8507 | |
| Stochastique (14,3,5): | 40.52 | |
| TEMA (21): | 0.2126 | |
| Williams %R (14): | -35.29 | |
| Chande Momentum Oscillator (20): | 0.0210 | |
| Repulse (5,40,3): | 9.4794 | |
| ROCnROLL: | -1 | |
| TRIX (15,9): | -0.9000 | |
| Courbe Coppock: | 5.53 |
| MA7: | 0.2144 | |
| MA20: | 0.2110 | |
| MA50: | 0.2483 | |
| MA100: | 0.3302 | |
| MAexp7: | 0.2161 | |
| MAexp20: | 0.2198 | |
| MAexp50: | 0.2559 | |
| MAexp100: | 0.3208 | |
| Price / MA7: | +7.28% | |
| Price / MA20: | +9.00% | |
| Price / MA50: | -7.37% | |
| Price / MA100: | -30.35% | |
| Price / MAexp7: | +6.43% | |
| Price / MAexp20: | +4.64% | |
| Price / MAexp50: | -10.12% | |
| Price / MAexp100: | -28.30% |
News
Don't forget to follow the news on OREGE. At the time of publication of this analysis, the latest news was as follows:
- Résultats Annuels 2022 et Perspectives 2023
- Orège sells three solutions to Severn Trent Water to improve the performance of anaerobic digestion and biogas production
- Oddo BHF initiates coverage of Orege
- Scottish Water purchases five further Orège solutions for a total value of 1,5 million euros as part of its Net Zero emissions strategy
- Kepler Cheuvreux initiates coverage of Orège
About author
Online


Add a comment
Comments
0 comments on the analysis OREGE - Daily