OHLA - 1H - Technical analysis published on 02/02/2024 (GMT)
- 158
- 0
Click here for a new analysis!
- Timeframe : 1H
- - Analysis generated on
- Status : TARGET REACHED
Summary of the analysis

Additional analysis
Quotes
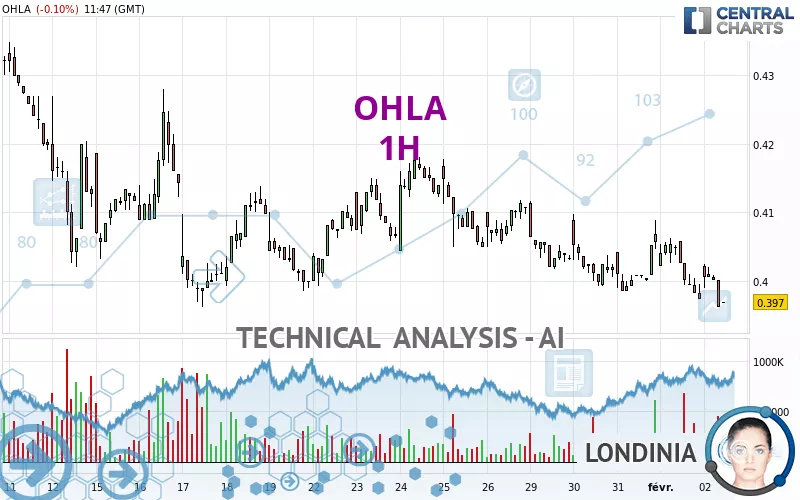
The OHLA price is 0.3972 EUR. The price is lower by -0.05% since the last closing with the lowest point at 0.3970 EUR and the highest point at 0.4024 EUR. The deviation from the price is +0.05% for the low point and -1.29% for the high point.A bullish opening was detected by the Central Gaps scanner. Buyers are trying to impose a bullish momentum in the very short term.
Bullish opening
Type : Bullish
Timeframe : Openning
Here is a more detailed summary of the historical variations registered by OHLA:
Near a new LOW record (1st january)
Type : Bearish
Timeframe : Weekly
Near a new LOW record (1 month)
Type : Bearish
Timeframe : Weekly
Technical
A technical analysis in 1H of this OHLA chart shows a sharp bearish trend. 92.86% of the signals given by moving averages are bearish. The overall trend is supported by the strong bearish signals from short-term moving averages. The Central Indicators scanner does not detect any result on moving averages that would impact this trend.
The probability of a further decline is moderate given the direction of the technical indicators.
But beware of excesses. The Central Indicators scanner currently detects this:
CCI indicator is oversold : under -100
Type : Neutral
Timeframe : 1 hour
Williams %R indicator is oversold : under -80
Type : Neutral
Timeframe : 1 hour
Pivot points : price is under support 1
Type : Neutral
Timeframe : Weekly
Central Patterns, the scanner specializing in chart patterns, did not identify any signals.
No result was found by the Central Candlesticks scanner on Japanese candlesticks.
| S2 | S1 | Price | R1 | R2 | R3 | |
|---|---|---|---|---|---|---|
| ProTrendLines | 0.3732 | 0.3924 | 0.3972 | 0.3987 | 0.4142 | 0.4368 |
| Change (%) | -6.04% | -1.21% | - | +0.38% | +4.28% | +9.97% |
| Change | -0.0240 | -0.0048 | - | +0.0015 | +0.0170 | +0.0396 |
| Level | Intermediate | Major | - | Major | Intermediate | Intermediate |
Pivot points can also be used to set your price objectives. Here is the price situation in relation to pivot points:
| Pivot points | S3 | S2 | S1 | PP | R1 | R2 | R3 |
|---|---|---|---|---|---|---|---|
| Standard | 0.3857 | 0.3915 | 0.3945 | 0.4003 | 0.4033 | 0.4091 | 0.4121 |
| Camarilla | 0.3950 | 0.3958 | 0.3966 | 0.3974 | 0.3982 | 0.3990 | 0.3998 |
| Woodie | 0.3842 | 0.3908 | 0.3930 | 0.3996 | 0.4018 | 0.4084 | 0.4106 |
| Fibonacci | 0.3915 | 0.3949 | 0.3970 | 0.4003 | 0.4037 | 0.4058 | 0.4091 |
| Pivot points | S3 | S2 | S1 | PP | R1 | R2 | R3 |
|---|---|---|---|---|---|---|---|
| Standard | 0.3813 | 0.3903 | 0.4005 | 0.4095 | 0.4197 | 0.4287 | 0.4389 |
| Camarilla | 0.4055 | 0.4073 | 0.4090 | 0.4108 | 0.4126 | 0.4143 | 0.4161 |
| Woodie | 0.3820 | 0.3906 | 0.4012 | 0.4098 | 0.4204 | 0.4290 | 0.4396 |
| Fibonacci | 0.3903 | 0.3976 | 0.4021 | 0.4095 | 0.4168 | 0.4213 | 0.4287 |
| Pivot points | S3 | S2 | S1 | PP | R1 | R2 | R3 |
|---|---|---|---|---|---|---|---|
| Standard | 0.3086 | 0.3524 | 0.3796 | 0.4234 | 0.4506 | 0.4944 | 0.5216 |
| Camarilla | 0.3873 | 0.3938 | 0.4003 | 0.4068 | 0.4133 | 0.4198 | 0.4263 |
| Woodie | 0.3003 | 0.3483 | 0.3713 | 0.4193 | 0.4423 | 0.4903 | 0.5133 |
| Fibonacci | 0.3524 | 0.3795 | 0.3963 | 0.4234 | 0.4505 | 0.4673 | 0.4944 |
Numerical data
The following is the status of technical indicators and moving averages registered at the time this technical analysis was created:
| RSI (14): | 38.44 | |
| MACD (12,26,9): | -0.0012 | |
| Directional Movement: | -8.4715 | |
| AROON (14): | -92.8571 | |
| DEMA (21): | 0.3995 | |
| Parabolic SAR (0,02-0,02-0,2): | 0.4057 | |
| Elder Ray (13): | -0.0017 | |
| Super Trend (3,10): | 0.4060 | |
| Zig ZAG (10): | 0.3970 | |
| VORTEX (21): | 0.8656 | |
| Stochastique (14,3,5): | 19.28 | |
| TEMA (21): | 0.3993 | |
| Williams %R (14): | -98.31 | |
| Chande Momentum Oscillator (20): | -0.0068 | |
| Repulse (5,40,3): | -1.4419 | |
| ROCnROLL: | 2 | |
| TRIX (15,9): | -0.0322 | |
| Courbe Coppock: | 1.41 |
| MA7: | 0.4033 | |
| MA20: | 0.4115 | |
| MA50: | 0.4425 | |
| MA100: | 0.4222 | |
| MAexp7: | 0.3996 | |
| MAexp20: | 0.4011 | |
| MAexp50: | 0.4033 | |
| MAexp100: | 0.4076 | |
| Price / MA7: | -1.51% | |
| Price / MA20: | -3.48% | |
| Price / MA50: | -10.24% | |
| Price / MA100: | -5.92% | |
| Price / MAexp7: | -0.60% | |
| Price / MAexp20: | -0.97% | |
| Price / MAexp50: | -1.51% | |
| Price / MAexp100: | -2.55% |
News
Don't forget to follow the news on OHLA. At the time of publication of this analysis, the latest news was as follows:
- OHL Concesiones and IFM launch a Cash Tender Offer for 100% of the free float OHL México through the corporate vehicle Magenta Infraestructura
- OHL chooses IBM Cloud to Support its Digital Transformation Process
About author
Online


Add a comment
Comments
0 comments on the analysis OHLA - 1H