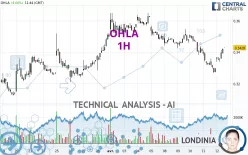
OHLA - 1H - Technical analysis published on 04/12/2024 (GMT)
- 137
- 0
- Timeframe : 1H
- - Analysis generated on
- Status : NEUTRAL

Summary of the analysis

Additional analysis
Quotes
OHLA rating 0.3420 EUR. On the day, this instrument gained +3.76% and was traded between 0.3340 EUR and 0.3424 EUR over the period. The price is currently at +2.40% from its lowest and -0.12% from its highest.The Central Gaps scanner detects a bullish opening marking the presence of buyers ahead of sellers at the opening but not sufficiently marked to allow the price to register a quotation gap.
Bullish opening
Type : Bullish
Timeframe : Openning
Here is a more detailed summary of the historical variations registered by OHLA:
Near a new LOW record (5 years)
Type : Bearish
Timeframe : Weekly
Abnormal volumes on OHLA were detected by the Central Volumes scanner:
Abnormal volumes
Timeframe : 20 days
Technical
Technical analysis of OHLA in 1H shows an overall slightly bearish trend. 60.71% of the signals given by moving averages are bullish. As the signals currently given by short-term moving averages are rather neutral, the overall trend could quickly return to neutral as well. The Central Indicators scanner detects bullish signals on moving averages that could impact this trend:
Bullish trend reversal : adaptative moving average 20
Type : Bullish
Timeframe : 1 hour
Bullish price crossover with adaptative moving average 50
Type : Bullish
Timeframe : 1 hour
In fact, 12 technical indicators on 18 studied are currently bullish. But beware of excesses. The Central Indicators scanner currently detects this:
Williams %R indicator is overbought : over -20
Type : Neutral
Timeframe : 1 hour
Pivot points : price is over resistance 1
Type : Neutral
Timeframe : 1 hour
Pivot points : price is under support 1
Type : Neutral
Timeframe : Weekly
Aroon indicator bullish trend
Type : Bullish
Timeframe : 1 hour
No signals are given by Central Patterns, a market scanner specialised in chart patterns, resistances and supports.
No result was found by the Central Candlesticks scanner on Japanese candlesticks.
| S3 | S2 | S1 | Price | R1 | R2 | R3 | |
|---|---|---|---|---|---|---|---|
| ProTrendLines | 0.3210 | 0.3254 | 0.3301 | 0.3420 | 0.3424 | 0.3521 | 0.3650 |
| Change (%) | -6.14% | -4.85% | -3.48% | - | +0.12% | +2.95% | +6.73% |
| Change | -0.0210 | -0.0166 | -0.0119 | - | +0.0004 | +0.0101 | +0.0230 |
| Level | Intermediate | Minor | Minor | - | Minor | Intermediate | Major |
Attention could also be paid to pivot points to set price objectives:
| Pivot points | S3 | S2 | S1 | PP | R1 | R2 | R3 |
|---|---|---|---|---|---|---|---|
| Standard | 0.3094 | 0.3180 | 0.3238 | 0.3324 | 0.3382 | 0.3468 | 0.3526 |
| Camarilla | 0.3256 | 0.3270 | 0.3283 | 0.3296 | 0.3309 | 0.3322 | 0.3336 |
| Woodie | 0.3080 | 0.3173 | 0.3224 | 0.3317 | 0.3368 | 0.3461 | 0.3512 |
| Fibonacci | 0.3180 | 0.3235 | 0.3269 | 0.3324 | 0.3379 | 0.3413 | 0.3468 |
| Pivot points | S3 | S2 | S1 | PP | R1 | R2 | R3 |
|---|---|---|---|---|---|---|---|
| Standard | 0.3253 | 0.3367 | 0.3423 | 0.3537 | 0.3593 | 0.3707 | 0.3763 |
| Camarilla | 0.3433 | 0.3449 | 0.3464 | 0.3480 | 0.3496 | 0.3511 | 0.3527 |
| Woodie | 0.3225 | 0.3353 | 0.3395 | 0.3523 | 0.3565 | 0.3693 | 0.3735 |
| Fibonacci | 0.3367 | 0.3432 | 0.3472 | 0.3537 | 0.3602 | 0.3642 | 0.3707 |
| Pivot points | S3 | S2 | S1 | PP | R1 | R2 | R3 |
|---|---|---|---|---|---|---|---|
| Standard | 0.2357 | 0.2741 | 0.3121 | 0.3505 | 0.3885 | 0.4269 | 0.4649 |
| Camarilla | 0.3290 | 0.3360 | 0.3430 | 0.3500 | 0.3570 | 0.3640 | 0.3710 |
| Woodie | 0.2354 | 0.2740 | 0.3118 | 0.3504 | 0.3882 | 0.4268 | 0.4646 |
| Fibonacci | 0.2741 | 0.3033 | 0.3214 | 0.3505 | 0.3797 | 0.3978 | 0.4269 |
Numerical data
The following are the details of the technical indicators and moving averages that were collected to generate this technical analysis:
| RSI (14): | 54.38 | |
| MACD (12,26,9): | -0.0024 | |
| Directional Movement: | 6.7832 | |
| AROON (14): | 42.8571 | |
| DEMA (21): | 0.3341 | |
| Parabolic SAR (0,02-0,02-0,2): | 0.3276 | |
| Elder Ray (13): | 0.0042 | |
| Super Trend (3,10): | 0.3306 | |
| Zig ZAG (10): | 0.3412 | |
| VORTEX (21): | 0.7730 | |
| Stochastique (14,3,5): | 76.41 | |
| TEMA (21): | 0.3343 | |
| Williams %R (14): | -7.59 | |
| Chande Momentum Oscillator (20): | 0.0062 | |
| Repulse (5,40,3): | 1.3543 | |
| ROCnROLL: | -1 | |
| TRIX (15,9): | -0.1550 | |
| Courbe Coppock: | 3.23 |
| MA7: | 0.3453 | |
| MA20: | 0.3381 | |
| MA50: | 0.3613 | |
| MA100: | 0.4028 | |
| MAexp7: | 0.3369 | |
| MAexp20: | 0.3377 | |
| MAexp50: | 0.3420 | |
| MAexp100: | 0.3433 | |
| Price / MA7: | -0.96% | |
| Price / MA20: | +1.15% | |
| Price / MA50: | -5.34% | |
| Price / MA100: | -15.09% | |
| Price / MAexp7: | +1.51% | |
| Price / MAexp20: | +1.27% | |
| Price / MAexp50: | -0% | |
| Price / MAexp100: | -0.38% |
News
Don't forget to follow the news on OHLA. At the time of publication of this analysis, the latest news was as follows:
- OHL Concesiones and IFM launch a Cash Tender Offer for 100% of the free float OHL México through the corporate vehicle Magenta Infraestructura
- OHL chooses IBM Cloud to Support its Digital Transformation Process
About author
Online


Add a comment
Comments
0 comments on the analysis OHLA - 1H