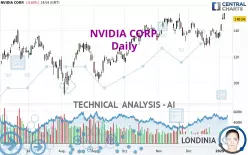
NVIDIA CORP. - Daily - Technical analysis published on 01/07/2025 (GMT)
- 501
- 0
Click here for a new analysis!
- Timeframe : Daily
- - Analysis generated on
- Status : INVALID

Summary of the analysis

Additional analysis
Quotes
The NVIDIA CORP. price is 148.57 USD. The price registered a decrease of -0.58% on the session and was traded between 148.30 USD and 153.13 USD over the period. The price is currently at +0.18% from its lowest and -2.98% from its highest.The Central Gaps scanner detects a bullish gap which is a sign that buyers have taken the lead in the very short term.
Opening Gap UP
Type : Bullish
Timeframe : Openning
So that you have an overall view of the price change, here is a table showing the variations over several periods:
Near a new HIGH record (5 years)
Type : Bullish
Timeframe : Weekly
Near a new HIGH record (1 year)
Type : Bullish
Timeframe : Weekly
New HIGH record (1st january)
Type : Bullish
Timeframe : Weekly
New HIGH record (1 month)
Type : Bullish
Timeframe : Weekly
Technical
Technical analysis of NVIDIA CORP. in Daily shows a strongly overall bullish trend. 89.29% of the signals given by moving averages are bullish. The overall trend is supported by the strong bullish signals from short-term moving averages. The Central Indicators scanner detects a bullish signal on moving averages that could impact this trend:
Bullish trend reversal : Moving Average 20
Type : Bullish
Timeframe : Daily
Technical indicators are strongly bullish, suggesting that the price increase should continue.
Caution: the Central Indicators scanner currently detects an excess:
CCI indicator is overbought : over 100
Type : Neutral
Timeframe : Daily
Previous candle closed over Bollinger bands
Type : Neutral
Timeframe : Daily
Williams %R indicator is overbought : over -20
Type : Neutral
Timeframe : Daily
Pivot points : price is over resistance 1
Type : Neutral
Timeframe : Weekly
Central Patterns, the market scanner focusing on chart patterns, resistances and supports found this result:
Resistance of channel is broken
Type : Bullish
Timeframe : Daily
No result was found by the Central Candlesticks scanner on Japanese candlesticks.
| S3 | S2 | S1 | Price | R1 | |
|---|---|---|---|---|---|
| ProTrendLines | 118.45 | 129.44 | 135.57 | 148.57 | 148.88 |
| Change (%) | -20.27% | -12.88% | -8.75% | - | +0.21% |
| Change | -30.12 | -19.13 | -13.00 | - | +0.31 |
| Level | Minor | Major | Major | - | Major |
Attention could also be paid to pivot points to set price objectives:
| Pivot points | S3 | S2 | S1 | PP | R1 | R2 | R3 |
|---|---|---|---|---|---|---|---|
| Standard | 143.11 | 145.46 | 147.45 | 149.80 | 151.79 | 154.14 | 156.13 |
| Camarilla | 148.24 | 148.63 | 149.03 | 149.43 | 149.83 | 150.23 | 150.62 |
| Woodie | 142.92 | 145.37 | 147.26 | 149.71 | 151.60 | 154.05 | 155.94 |
| Fibonacci | 145.46 | 147.12 | 148.15 | 149.80 | 151.46 | 152.49 | 154.14 |
| Pivot points | S3 | S2 | S1 | PP | R1 | R2 | R3 |
|---|---|---|---|---|---|---|---|
| Standard | 126.16 | 130.00 | 137.23 | 141.07 | 148.30 | 152.14 | 159.37 |
| Camarilla | 141.43 | 142.44 | 143.46 | 144.47 | 145.49 | 146.50 | 147.51 |
| Woodie | 127.87 | 130.85 | 138.94 | 141.92 | 150.01 | 152.99 | 161.08 |
| Fibonacci | 130.00 | 134.23 | 136.84 | 141.07 | 145.30 | 147.91 | 152.14 |
| Pivot points | S3 | S2 | S1 | PP | R1 | R2 | R3 |
|---|---|---|---|---|---|---|---|
| Standard | 105.57 | 116.22 | 125.25 | 135.90 | 144.93 | 155.58 | 164.61 |
| Camarilla | 128.88 | 130.68 | 132.49 | 134.29 | 136.09 | 137.90 | 139.70 |
| Woodie | 104.77 | 115.82 | 124.45 | 135.50 | 144.13 | 155.18 | 163.81 |
| Fibonacci | 116.22 | 123.73 | 128.38 | 135.90 | 143.41 | 148.06 | 155.58 |
Numerical data
The following is the status of the technical indicators and moving averages at the time of publication of this technical analysis:
| RSI (14): | 64.03 | |
| MACD (12,26,9): | 1.0000 | |
| Directional Movement: | 16.90 | |
| AROON (14): | 85.71 | |
| DEMA (21): | 139.66 | |
| Parabolic SAR (0,02-0,02-0,2): | 129.23 | |
| Elder Ray (13): | 10.43 | |
| Super Trend (3,10): | 133.71 | |
| Zig ZAG (10): | 149.43 | |
| VORTEX (21): | 0.9900 | |
| Stochastique (14,3,5): | 87.65 | |
| TEMA (21): | 140.55 | |
| Williams %R (14): | -10.79 | |
| Chande Momentum Oscillator (20): | 19.04 | |
| Repulse (5,40,3): | 3.1800 | |
| ROCnROLL: | 1 | |
| TRIX (15,9): | -0.0700 | |
| Courbe Coppock: | 7.11 |
| MA7: | 140.13 | |
| MA20: | 137.24 | |
| MA50: | 140.00 | |
| MA100: | 131.76 | |
| MAexp7: | 141.47 | |
| MAexp20: | 138.94 | |
| MAexp50: | 137.33 | |
| MAexp100: | 131.53 | |
| Price / MA7: | +6.02% | |
| Price / MA20: | +8.26% | |
| Price / MA50: | +6.12% | |
| Price / MA100: | +12.76% | |
| Price / MAexp7: | +5.03% | |
| Price / MAexp20: | +6.94% | |
| Price / MAexp50: | +8.19% | |
| Price / MAexp100: | +12.96% |
News
The last news published on NVIDIA CORP. at the time of the generation of this analysis was as follows:
- CORSAIR and ORIGIN PC Deliver AI-Powered Microservices for Enthusiasts and Creators with NVIDIA NIM on RTX PCs
- Innoviz, in Collaboration with NVIDIA, Showcasing Cutting-Edge Perception Software with NVIDIA DRIVE AGX Orin at CES 2025, Unveiling New Software-Driven Features
- KRAFTON Unveiled Co-Playable Character Built with NVIDIA ACE at CES 2025
- MediaTek Collaborates with NVIDIA on the New NVIDIA GB10 Grace Blackwell Superchip Powering the NVIDIA Project DIGITS Personal AI Supercomputer
- Wemade Next to Develop an AI Boss in MIR5 in Collaboration with NVIDIA
About author

Online


Add a comment
Comments
0 comments on the analysis NVIDIA CORP. - Daily