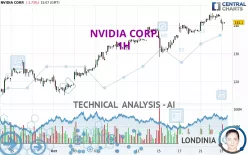
NVIDIA CORP. - 1H - Technical analysis published on 10/23/2024 (GMT)
- 172
- 0
Click here for a new analysis!
- Timeframe : 1H
- - Analysis generated on
- Status : LEVEL MAINTAINED

Summary of the analysis

Additional analysis
Quotes
NVIDIA CORP. rating 141.09 USD. The price is lower by -1.74% since the last closing with the lowest point at 138.26 USD and the highest point at 142.43 USD. The deviation from the price is +2.05% for the low point and -0.94% for the high point.The Central Gaps scanner detects a bearish opening. A small advantage for sellers in the very short term.
Bearish opening
Type : Bearish
Timeframe : Openning
Here is a more detailed summary of the historical variations registered by NVIDIA CORP.:
New HIGH record (5 years)
Type : Bullish
Timeframe : Weekly
Near a new HIGH record (1 year)
Type : Bullish
Timeframe : Weekly
Near a new HIGH record (1st january)
Type : Bullish
Timeframe : Weekly
Near a new HIGH record (1 month)
Type : Bullish
Timeframe : Weekly
Technical
Technical analysis of NVIDIA CORP. in 1H shows an overall bullish trend. 75.00% of the signals given by moving averages are bullish. Caution: the neutral signals currently given by the short-term moving averages indicate that this bullish trend is showing signs of running out of steam. The Central Indicators market scanner currently does not detect any result that concerns moving averages.
On the 18 technical indicators analysed, 2 are bullish, 10 are neutral and 6 are bearish. Central Indicators, the scanner specialised in technical indicators, has identified these signals:
Pivot points : price is under support 1
Type : Neutral
Timeframe : 1 hour
Momentum indicator is back over 0
Type : Bullish
Timeframe : 1 hour
The Central Patterns scanner, which studies chart patterns, resistances and supports, has identified these signals:
Near horizontal support
Type : Bullish
Timeframe : 1 hour
Support of channel is broken
Type : Bearish
Timeframe : 1 hour
The presence of a bullish Japanese candlestick pattern detected by Central Candlesticks that could cause a very short term rebound was also detected:
Bullish harami cross
Type : Bullish
Timeframe : 1 hour
| S3 | S2 | S1 | Price | R1 | |
|---|---|---|---|---|---|
| ProTrendLines | 127.65 | 135.57 | 140.89 | 141.09 | 144.42 |
| Change (%) | -9.53% | -3.91% | -0.14% | - | +2.36% |
| Change | -13.44 | -5.52 | -0.20 | - | +3.33 |
| Level | Intermediate | Major | Intermediate | - | Intermediate |
Pivot points can also be used to set your price objectives. Here is the price situation in relation to pivot points:
| Pivot points | S3 | S2 | S1 | PP | R1 | R2 | R3 |
|---|---|---|---|---|---|---|---|
| Standard | 139.47 | 140.62 | 142.11 | 143.26 | 144.75 | 145.90 | 147.39 |
| Camarilla | 142.86 | 143.11 | 143.35 | 143.59 | 143.83 | 144.07 | 144.32 |
| Woodie | 139.63 | 140.71 | 142.27 | 143.35 | 144.91 | 145.99 | 147.55 |
| Fibonacci | 140.62 | 141.63 | 142.26 | 143.26 | 144.27 | 144.90 | 145.90 |
| Pivot points | S3 | S2 | S1 | PP | R1 | R2 | R3 |
|---|---|---|---|---|---|---|---|
| Standard | 118.71 | 123.73 | 130.86 | 135.88 | 143.01 | 148.03 | 155.16 |
| Camarilla | 134.66 | 135.77 | 136.89 | 138.00 | 139.11 | 140.23 | 141.34 |
| Woodie | 119.78 | 124.26 | 131.93 | 136.41 | 144.08 | 148.56 | 156.23 |
| Fibonacci | 123.73 | 128.37 | 131.24 | 135.88 | 140.52 | 143.39 | 148.03 |
| Pivot points | S3 | S2 | S1 | PP | R1 | R2 | R3 |
|---|---|---|---|---|---|---|---|
| Standard | 78.97 | 89.95 | 105.70 | 116.68 | 132.43 | 143.41 | 159.16 |
| Camarilla | 114.09 | 116.54 | 118.99 | 121.44 | 123.89 | 126.34 | 128.79 |
| Woodie | 81.35 | 91.14 | 108.08 | 117.87 | 134.81 | 144.60 | 161.54 |
| Fibonacci | 89.95 | 100.16 | 106.47 | 116.68 | 126.89 | 133.20 | 143.41 |
Numerical data
The following is the status of the technical indicators and moving averages at the time of publication of this technical analysis:
| RSI (14): | 47.11 | |
| MACD (12,26,9): | 1.1900 | |
| Directional Movement: | -7.71 | |
| AROON (14): | -50.00 | |
| DEMA (21): | 143.11 | |
| Parabolic SAR (0,02-0,02-0,2): | 144.08 | |
| Elder Ray (13): | -2.27 | |
| Super Trend (3,10): | 139.52 | |
| Zig ZAG (10): | 140.11 | |
| VORTEX (21): | 1.0400 | |
| Stochastique (14,3,5): | 46.59 | |
| TEMA (21): | 142.98 | |
| Williams %R (14): | -67.50 | |
| Chande Momentum Oscillator (20): | -0.96 | |
| Repulse (5,40,3): | -0.1600 | |
| ROCnROLL: | -1 | |
| TRIX (15,9): | 0.1700 | |
| Courbe Coppock: | 3.80 |
| MA7: | 138.54 | |
| MA20: | 131.04 | |
| MA50: | 123.53 | |
| MA100: | 121.80 | |
| MAexp7: | 142.00 | |
| MAexp20: | 141.33 | |
| MAexp50: | 138.57 | |
| MAexp100: | 134.34 | |
| Price / MA7: | +1.84% | |
| Price / MA20: | +7.67% | |
| Price / MA50: | +14.22% | |
| Price / MA100: | +15.84% | |
| Price / MAexp7: | -0.64% | |
| Price / MAexp20: | -0.17% | |
| Price / MAexp50: | +1.82% | |
| Price / MAexp100: | +5.02% |
News
The latest news and videos published on NVIDIA CORP. at the time of the analysis were as follows:
-
 Northern Data Group: Europe’s largest independent NVIDIA hardware cluster
- The AI solutions for Indonesian businesses received international recognition through the lens of NVIDIA
- LITEON Debuts Integrated AI Cloud Server Rack Solutions Powered by NVIDIA at 2024 OCP Summit
- Supermicro's Liquid-Cooled SuperClusters for AI Data Centers Powered by NVIDIA GB200 NVL72 and NVIDIA HGX B200 Systems, Deliver a New Paradigm of Energy-Efficient Exascale Computing
- Supermicro Adds New Petascale JBOF All-Flash Storage Solution Integrating NVIDIA BlueField-3 DPU for AI Data Pipeline Acceleration
About author

Online


Add a comment
Comments
0 comments on the analysis NVIDIA CORP. - 1H