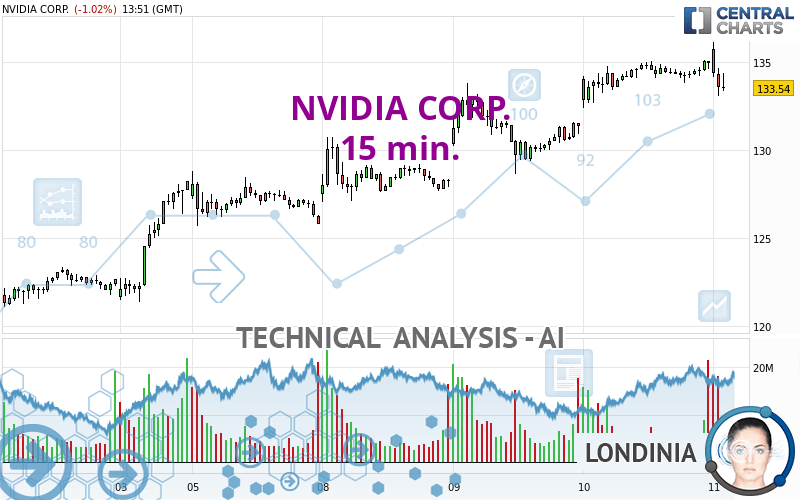
NVIDIA CORP. - 15 min. - Technical analysis published on 07/11/2024 (GMT)
- 97
- 0
Click here for a new analysis!
- Timeframe : 15 min.
- - Analysis generated on
- Status : INVALID

Summary of the analysis

Additional analysis
Quotes
NVIDIA CORP. rating 133.70 USD. On the day, this instrument lost -0.90% with the lowest point at 133.10 USD and the highest point at 136.15 USD. The deviation from the price is +0.45% for the low point and -1.80% for the high point.The Central Gaps scanner detects the formation of a bullish gap marking the strong presence of buyers against sellers at the opening. This formed a quotation gap.
Opening Gap UP
Type : Bullish
Timeframe : Openning
So that you have an overall view of the price change, here is a table showing the variations over several periods:
Near a new HIGH record (5 years)
Type : Bullish
Timeframe : Weekly
Near a new HIGH record (1 year)
Type : Bullish
Timeframe : Weekly
Near a new HIGH record (1st january)
Type : Bullish
Timeframe : Weekly
Near a new HIGH record (1 month)
Type : Bullish
Timeframe : Weekly
Technical
A technical analysis in 15 min. of this NVIDIA CORP. chart shows a bullish trend. The signals given by moving averages are 78.57% bullish. This bullish trend could slow down given the neutral signals currently being given by short-term moving averages. There is no crossing of moving average by the price or crossing of moving averages between themselves.
An assessment of technical indicators shows a moderate bullish signal.
But beware of excesses. The Central Indicators scanner currently detects this:
CCI indicator is overbought : over 100
Type : Neutral
Timeframe : 15 minutes
Williams %R indicator is overbought : over -20
Type : Neutral
Timeframe : 15 minutes
Pivot points : price is over resistance 1
Type : Neutral
Timeframe : 15 minutes
Pivot points : price is over resistance 2
Type : Neutral
Timeframe : Weekly
Parabolic SAR indicator bullish reversal
Type : Bullish
Timeframe : 15 minutes
Aroon indicator bullish trend
Type : Bullish
Timeframe : 15 minutes
Momentum indicator is back over 0
Type : Bullish
Timeframe : 15 minutes
Central Patterns, the market scanner focusing on chart patterns, resistances and supports found this result:
Near horizontal resistance
Type : Bearish
Timeframe : 15 minutes
The presence of a bullish Japanese candlestick pattern detected by Central Candlesticks that could cause a very short term rebound was also detected:
Bullish engulfing lines
Type : Bullish
Timeframe : 15 minutes
| S3 | S2 | S1 | Price | R1 | R2 | |
|---|---|---|---|---|---|---|
| ProTrendLines | 106.93 | 118.11 | 125.60 | 133.70 | 135.58 | 140.76 |
| Change (%) | -20.02% | -11.66% | -6.06% | - | +1.41% | +5.28% |
| Change | -26.77 | -15.59 | -8.10 | - | +1.88 | +7.06 |
| Level | Minor | Major | Intermediate | - | Major | Intermediate |
Attention could also be paid to pivot points to set price objectives:
| Pivot points | S3 | S2 | S1 | PP | R1 | R2 | R3 |
|---|---|---|---|---|---|---|---|
| Standard | 130.51 | 131.46 | 133.19 | 134.14 | 135.87 | 136.82 | 138.55 |
| Camarilla | 134.17 | 134.42 | 134.66 | 134.91 | 135.16 | 135.40 | 135.65 |
| Woodie | 130.89 | 131.66 | 133.57 | 134.34 | 136.25 | 137.02 | 138.93 |
| Fibonacci | 131.46 | 132.49 | 133.12 | 134.14 | 135.17 | 135.80 | 136.82 |
| Pivot points | S3 | S2 | S1 | PP | R1 | R2 | R3 |
|---|---|---|---|---|---|---|---|
| Standard | 110.14 | 114.48 | 120.16 | 124.50 | 130.18 | 134.52 | 140.20 |
| Camarilla | 123.08 | 123.99 | 124.91 | 125.83 | 126.75 | 127.67 | 128.59 |
| Woodie | 110.80 | 114.82 | 120.82 | 124.84 | 130.84 | 134.86 | 140.86 |
| Fibonacci | 114.48 | 118.31 | 120.68 | 124.50 | 128.33 | 130.70 | 134.52 |
| Pivot points | S3 | S2 | S1 | PP | R1 | R2 | R3 |
|---|---|---|---|---|---|---|---|
| Standard | 81.33 | 96.66 | 110.10 | 125.43 | 138.87 | 154.20 | 167.64 |
| Camarilla | 115.63 | 118.27 | 120.90 | 123.54 | 126.18 | 128.82 | 131.45 |
| Woodie | 80.39 | 96.19 | 109.16 | 124.96 | 137.93 | 153.73 | 166.70 |
| Fibonacci | 96.66 | 107.65 | 114.44 | 125.43 | 136.42 | 143.21 | 154.20 |
Numerical data
The following is the status of technical indicators and moving averages registered at the time this technical analysis was created:
| RSI (14): | 66.09 | |
| MACD (12,26,9): | 0.5600 | |
| Directional Movement: | 7.84 | |
| AROON (14): | 35.71 | |
| DEMA (21): | 135.06 | |
| Parabolic SAR (0,02-0,02-0,2): | 133.83 | |
| Elder Ray (13): | 0.37 | |
| Super Trend (3,10): | 133.28 | |
| Zig ZAG (10): | 134.93 | |
| VORTEX (21): | 1.1300 | |
| Stochastique (14,3,5): | 73.05 | |
| TEMA (21): | 134.86 | |
| Williams %R (14): | -13.39 | |
| Chande Momentum Oscillator (20): | 0.05 | |
| Repulse (5,40,3): | 0.4700 | |
| ROCnROLL: | 1 | |
| TRIX (15,9): | 0.0800 | |
| Courbe Coppock: | 0.14 |
| MA7: | 129.29 | |
| MA20: | 127.94 | |
| MA50: | 112.01 | |
| MA100: | 98.69 | |
| MAexp7: | 134.62 | |
| MAexp20: | 134.23 | |
| MAexp50: | 132.81 | |
| MAexp100: | 130.85 | |
| Price / MA7: | +3.41% | |
| Price / MA20: | +4.50% | |
| Price / MA50: | +19.36% | |
| Price / MA100: | +35.47% | |
| Price / MAexp7: | -0.70% | |
| Price / MAexp20: | -0.41% | |
| Price / MAexp50: | +0.66% | |
| Price / MAexp100: | +2.16% |
News
Don't forget to follow the news on NVIDIA CORP.. At the time of publication of this analysis, the latest news was as follows:
-
 Why Nvidia, Tesla, Amazon And More Are Betting Big On AI-Powered Humanoid Robots
-
Want to become the next Nvidia? Tech trailblazer explains how you can
- VNG GreenNode collaborates with NVIDIA to launch a large-scale AI Cloud infrastructure in Southeast Asia, offering a global AI Cloud platform
-
Where now for NVIDIA? #NVIDIA #AI #news
-
How Nvidia became the world’s most valuable company
About author

Online


Add a comment
Comments
0 comments on the analysis NVIDIA CORP. - 15 min.