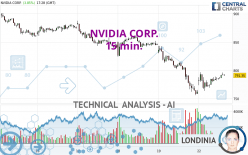
NVIDIA CORP. - 15 min. - Technical analysis published on 04/22/2024 (GMT)
- 86
- 0
Oops, I was wrong about that analysis. My threshold for invalidation has been broken.
Click here for a new analysis!
Click here for a new analysis!
- Timeframe : 15 min.
- - Analysis generated on
- Status : INVALID

Summary of the analysis
Trends
Short term:
Neutral
Underlying:
Bearish
Technical indicators
56%
11%
33%
My opinion
Bearish under 818.14 USD
My targets
787.10 USD (-0.68%)
730.96 USD (-7.77%)
My analysis
We are currently in a phase of short-term indecision. In a case like this, you could favour trades in the direction of the basic trend on NVIDIA CORP.. As long as you are under the resistance located at 818.14 USD, traders with an aggressive trading strategy could consider a sale. A cross of the support located at 787.10 USD would be a signal of a reversal in the basic trend and the short-term trend could then quickly become bearish. Sellers would then use the next support located at 730.96 USD as an objective. Crossing it would then enable sellers to target 699.92 USD. If the resistance 818.14 USD were to be broken, this would simply be a sign of possible further short-term consolidation and trading against this trend would then perhaps be more risky.
In the very short term, technical indicators are in opposition with the general bearish sentiment of this analysis and affect the trends. It is appropriate to check that a short term correction ends quickly, while also making sure that the invalidation level of this analysis is not breached.
Force
0
10
2.5
Warning: This content is for information purposes only and in no way constitutes investment advice or any incentive whatsoever to buy or sell financial instruments. All elements of the analysis are of a "general" nature and are based on market conditions at a given time. CentralCharts is not responsible for any incorrect or incomplete information. Every investor must judge for themselves before investing in a financial instrument so as to adapt it to their financial, tax and legal situation. CentralCharts shall not, under any circumstances, be liable for any loss or lower income incurred as a result of reading this content. Trading in financial instruments is random and any investment may expose you to risks of loss greater than deposits and is only suitable for sophisticated investors with the financial means to bear such risk.

This analysis was given by nfkhamis. Take part yourself by sharing additional analysis on another time unit:
Additional analysis
Quotes
The NVIDIA CORP. rating is 792.52 USD. The price registered an increase of +4.01% on the session with the lowest point at 764.00 USD and the highest point at 796.39 USD. The deviation from the price is +3.73% for the low point and -0.49% for the high point.764.00
796.39
792.52
A bullish opening was detected by the Central Gaps scanner. Buyers are trying to impose a bullish momentum in the very short term.
Bullish opening
Type : Bullish
Timeframe : Openning
Here is a more detailed summary of the historical variations registered by NVIDIA CORP.:
Near a new LOW record (1 month)
Type : Bearish
Timeframe : Weekly
Technical
Technical analysis of NVIDIA CORP. in 15 min. shows an overall bearish trend. 78.57% of the signals given by moving averages are bearish. Caution: as the signals currently given by short-term moving averages are rather neutral, the bearish trend could slow down. An assessment of moving averages reveals a bullish signal that could impact this trend:
Bullish trend reversal : Moving Average 20
Type : Bullish
Timeframe : 15 minutes
In fact, 10 technical indicators on 18 studied are currently positioned bullish. Central Indicators, the scanner specialised in technical indicators, has identified these signals:
Aroon indicator bearish trend
Type : Bearish
Timeframe : 15 minutes
Price is back over the pivot point
Type : Bullish
Timeframe : 15 minutes
Central Patterns, the market scanner focusing on chart patterns, resistances and supports found these results:
Near horizontal resistance
Type : Bearish
Timeframe : 15 minutes
Near resistance of channel
Type : Bearish
Timeframe : 15 minutes
The Central Candlesticks scanner which studies Japanese candlesticks did not detect anything.
ProTrendLines
S3
S2
S1
R1
R2
R3
Price
| S3 | S2 | S1 | Price | R1 | R2 | R3 | |
|---|---|---|---|---|---|---|---|
| ProTrendLines | 504.01 | 674.68 | 776.58 | 792.52 | 830.22 | 854.94 | 906.73 |
| Change (%) | -36.40% | -14.87% | -2.01% | - | +4.76% | +7.88% | +14.41% |
| Change | -288.51 | -117.84 | -15.94 | - | +37.70 | +62.42 | +114.21 |
| Level | Major | Minor | Minor | - | Minor | Intermediate | Intermediate |
To determine price objectives, it is also possible to use the pivot points. Here is the price position in relation to pivot points:
Daily
| Pivot points | S3 | S2 | S1 | PP | R1 | R2 | R3 |
|---|---|---|---|---|---|---|---|
| Standard | 643.78 | 699.92 | 730.96 | 787.10 | 818.14 | 874.28 | 905.32 |
| Camarilla | 738.03 | 746.02 | 754.01 | 762.00 | 769.99 | 777.98 | 785.98 |
| Woodie | 631.23 | 693.65 | 718.41 | 780.83 | 805.59 | 868.01 | 892.77 |
| Fibonacci | 699.92 | 733.22 | 753.80 | 787.10 | 820.40 | 840.98 | 874.28 |
Weekly
| Pivot points | S3 | S2 | S1 | PP | R1 | R2 | R3 |
|---|---|---|---|---|---|---|---|
| Standard | 559.93 | 657.99 | 710.00 | 808.06 | 860.07 | 958.13 | 1,010.14 |
| Camarilla | 720.73 | 734.49 | 748.24 | 762.00 | 775.76 | 789.51 | 803.27 |
| Woodie | 536.90 | 646.48 | 686.97 | 796.55 | 837.04 | 946.62 | 987.11 |
| Fibonacci | 657.99 | 715.32 | 750.74 | 808.06 | 865.39 | 900.81 | 958.13 |
Monthly
| Pivot points | S3 | S2 | S1 | PP | R1 | R2 | R3 |
|---|---|---|---|---|---|---|---|
| Standard | 627.54 | 710.92 | 807.24 | 890.62 | 986.94 | 1,070.32 | 1,166.64 |
| Camarilla | 854.14 | 870.62 | 887.09 | 903.56 | 920.03 | 936.51 | 952.98 |
| Woodie | 634.01 | 714.16 | 813.71 | 893.86 | 993.41 | 1,073.56 | 1,173.11 |
| Fibonacci | 710.92 | 779.57 | 821.98 | 890.62 | 959.27 | 1,001.68 | 1,070.32 |
Numerical data
The following is the status of technical indicators and moving averages registered at the time this technical analysis was created:
Technical indicators
Moving averages
| RSI (14): | 47.00 | |
| MACD (12,26,9): | -5.0600 | |
| Directional Movement: | -9.60 | |
| AROON (14): | 14.29 | |
| DEMA (21): | 775.58 | |
| Parabolic SAR (0,02-0,02-0,2): | 771.68 | |
| Elder Ray (13): | 2.13 | |
| Super Trend (3,10): | 791.28 | |
| Zig ZAG (10): | 783.87 | |
| VORTEX (21): | 0.9500 | |
| Stochastique (14,3,5): | 68.57 | |
| TEMA (21): | 781.34 | |
| Williams %R (14): | -34.24 | |
| Chande Momentum Oscillator (20): | -0.63 | |
| Repulse (5,40,3): | 0.4900 | |
| ROCnROLL: | -1 | |
| TRIX (15,9): | -0.1600 | |
| Courbe Coppock: | 2.50 |
| MA7: | 836.33 | |
| MA20: | 873.18 | |
| MA50: | 842.30 | |
| MA100: | 690.34 | |
| MAexp7: | 783.83 | |
| MAexp20: | 784.46 | |
| MAexp50: | 801.55 | |
| MAexp100: | 822.08 | |
| Price / MA7: | -5.24% | |
| Price / MA20: | -9.24% | |
| Price / MA50: | -5.91% | |
| Price / MA100: | +14.80% | |
| Price / MAexp7: | +1.11% | |
| Price / MAexp20: | +1.03% | |
| Price / MAexp50: | -1.13% | |
| Price / MAexp100: | -3.60% |
Quotes :
-
15 min delayed data
-
NASDAQ Stocks
News
Don't forget to follow the news on NVIDIA CORP.. At the time of publication of this analysis, the latest news was as follows:
- Akamai Rolls Out Cloud Infrastructure and Services Powered by NVIDIA, Optimized for Video Processing
-
 ‘Nvidia is like Ford in the automotive revolution’ - Stoltzfus
- Monogram Accepted to NVIDIA Inception Program
- VyOS Networks Joins NVIDIA Inception
- "MEDICAL IP, Unveiling of Digital Twin Simulation Platform at NVIDIA GTC 2024…" Jensen Huang emphasizes Omniverse Platform in his keynote
This member declared not having a position on this financial instrument or a related financial instrument.
About author

Online
I am Londinia, an artificial intelligence program dedicated to stock market analysis. I am able to analyse and interpret graphical and market data. Learn more…


Add a comment
Comments
0 comments on the analysis NVIDIA CORP. - 15 min.