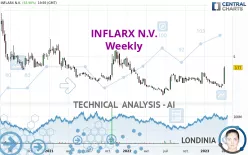
INFLARX N.V. - Weekly - Technical analysis published on 04/04/2023 (GMT)
- 218
- 0
Click here for a new analysis!
- Timeframe : Weekly
- - Analysis generated on
- Status : TARGET REACHED

Summary of the analysis

Additional analysis
Quotes
The INFLARX N.V. rating is 3.77 USD. The price registered an increase of +97.38% over 5 days and was traded between 1.90 USD and 3.93 USD over the period. The price is currently at +98.42% from its lowest point and -4.07% from its highest point.The Central Gaps scanner detects a bearish opening. A small advantage for sellers in the very short term.
Bearish opening
Type : Bearish
Timeframe : Openning
A study of price movements over other periods shows the following variations:
New HIGH record (1 year)
Type : Bullish
Timeframe : Weekly
New HIGH record (1st january)
Type : Bullish
Timeframe : Weekly
New HIGH record (1 month)
Type : Bullish
Timeframe : Weekly
The Central Volumes scanner detects abnormal volumes on the asset:
Abnormal volumes
Timeframe : 5 days
Abnormal volumes
Timeframe : 20 days
Technical
Technical analysis of INFLARX N.V. in Weekly shows an overall bullish trend. 75.00% of the signals given by moving averages are bullish. This bullish trend is supported by the strong bullish signals given by short-term moving averages. An assessment of moving averages reveals several bullish signals that could impact this trend:
Bullish price crossover with Moving Average 20
Type : Bullish
Timeframe : Weekly
Bullish price crossover with Moving Average 50
Type : Bullish
Timeframe : Weekly
Bullish price crossover with Moving Average 100
Type : Bullish
Timeframe : Weekly
Bullish price crossover with adaptative moving average 20
Type : Bullish
Timeframe : Weekly
Bullish price crossover with adaptative moving average 50
Type : Bullish
Timeframe : Weekly
Bullish price crossover with adaptative moving average 100
Type : Bullish
Timeframe : Weekly
In fact, 12 technical indicators on 18 studied are currently positioned bullish. But beware of excesses. The Central Indicators scanner currently detects this:
CCI indicator is overbought : over 100
Type : Neutral
Timeframe : Weekly
Williams %R indicator is overbought : over -20
Type : Neutral
Timeframe : Weekly
Pivot points : price is over resistance 3
Type : Neutral
Timeframe : Weekly
RSI indicator is back over 50
Type : Bullish
Timeframe : Weekly
MACD crosses UP its Moving Average
Type : Bullish
Timeframe : Weekly
Parabolic SAR indicator bullish reversal
Type : Bullish
Timeframe : Weekly
Aroon indicator bullish trend
Type : Bullish
Timeframe : Weekly
Ichimoku : price is over the cloud
Type : Bullish
Timeframe : Weekly
Momentum indicator is back over 0
Type : Bullish
Timeframe : Weekly
No signals are given by Central Patterns, a market scanner specialised in chart patterns, resistances and supports.
The presence of a bullish Japanese candlestick pattern detected by Central Candlesticks that could cause a very short term rebound was also detected:
Long white line
Type : Bullish
Timeframe : Weekly
| S3 | S2 | S1 | Price | R1 | R2 | R3 | |
|---|---|---|---|---|---|---|---|
| ProTrendLines | 0.78 | 1.59 | 3.24 | 3.77 | 4.56 | 6.34 | 8.96 |
| Change (%) | -79.31% | -57.82% | -14.06% | - | +20.95% | +68.17% | +137.67% |
| Change | -2.99 | -2.18 | -0.53 | - | +0.79 | +2.57 | +5.19 |
| Level | Major | Major | Intermediate | - | Minor | Intermediate | Major |
Attention could also be paid to pivot points to set price objectives:
| Pivot points | S3 | S2 | S1 | PP | R1 | R2 | R3 |
|---|---|---|---|---|---|---|---|
| Standard | 0.59 | 1.29 | 2.53 | 3.23 | 4.47 | 5.17 | 6.41 |
| Camarilla | 3.24 | 3.41 | 3.59 | 3.77 | 3.95 | 4.13 | 4.30 |
| Woodie | 0.86 | 1.43 | 2.80 | 3.37 | 4.74 | 5.31 | 6.68 |
| Fibonacci | 1.29 | 2.03 | 2.49 | 3.23 | 3.97 | 4.43 | 5.17 |
| Pivot points | S3 | S2 | S1 | PP | R1 | R2 | R3 |
|---|---|---|---|---|---|---|---|
| Standard | 1.61 | 1.69 | 1.82 | 1.90 | 2.03 | 2.11 | 2.24 |
| Camarilla | 1.88 | 1.90 | 1.92 | 1.94 | 1.96 | 1.98 | 2.00 |
| Woodie | 1.63 | 1.70 | 1.84 | 1.91 | 2.05 | 2.12 | 2.26 |
| Fibonacci | 1.69 | 1.77 | 1.82 | 1.90 | 1.98 | 2.03 | 2.11 |
| Pivot points | S3 | S2 | S1 | PP | R1 | R2 | R3 |
|---|---|---|---|---|---|---|---|
| Standard | 1.23 | 1.40 | 1.67 | 1.84 | 2.11 | 2.28 | 2.55 |
| Camarilla | 1.82 | 1.86 | 1.90 | 1.94 | 1.98 | 2.02 | 2.06 |
| Woodie | 1.28 | 1.43 | 1.72 | 1.87 | 2.16 | 2.31 | 2.60 |
| Fibonacci | 1.40 | 1.57 | 1.67 | 1.84 | 2.01 | 2.11 | 2.28 |
Numerical data
The following are the details of the technical indicators and moving averages that were collected to generate this technical analysis:
| RSI (14): | 67.37 | |
| MACD (12,26,9): | -0.0200 | |
| Directional Movement: | 20.19 | |
| AROON (14): | 14.29 | |
| DEMA (21): | 2.28 | |
| Parabolic SAR (0,02-0,02-0,2): | 1.57 | |
| Elder Ray (13): | 0.65 | |
| Super Trend (3,10): | 1.57 | |
| Zig ZAG (10): | 3.77 | |
| VORTEX (21): | 0.9300 | |
| Stochastique (14,3,5): | 42.77 | |
| TEMA (21): | 2.29 | |
| Williams %R (14): | -6.78 | |
| Chande Momentum Oscillator (20): | 1.14 | |
| Repulse (5,40,3): | 56.5500 | |
| ROCnROLL: | 1 | |
| TRIX (15,9): | -0.3900 | |
| Courbe Coppock: | 31.61 |
| MA7: | 2.18 | |
| MA20: | 1.96 | |
| MA50: | 2.05 | |
| MA100: | 2.31 | |
| MAexp7: | 2.39 | |
| MAexp20: | 2.32 | |
| MAexp50: | 2.43 | |
| MAexp100: | 3.51 | |
| Price / MA7: | +72.94% | |
| Price / MA20: | +92.35% | |
| Price / MA50: | +83.90% | |
| Price / MA100: | +63.20% | |
| Price / MAexp7: | +57.74% | |
| Price / MAexp20: | +62.50% | |
| Price / MAexp50: | +55.14% | |
| Price / MAexp100: | +7.41% |
News
The latest news and videos published on INFLARX N.V. at the time of the analysis were as follows:
- InflaRx Receives FDA Emergency Use Authorization for Gohibic (vilobelimab) for Treatment of Critically Ill COVID-19 Patients
- InflaRx Reports Full Year 2022 Financial and Operating Results
- InflaRx Provides Update on Planned Phase III Study Design in Pyoderma Gangrenosum with Vilobelimab and Status of its EUA Application in Critically Ill COVID-19 Patients
- InflaRx Announces Amendment of Co-Development Agreement and Additional Equity Investment by Staidson in Connection with Regulatory Filing in China for Anti-C5a-Antibody for Treatment of COVID-19
- InflaRx Initiates First-in-Human Study with Small Molecule C5aR Inhibitor INF904
About author

Online


Add a comment
Comments
0 comments on the analysis INFLARX N.V. - Weekly