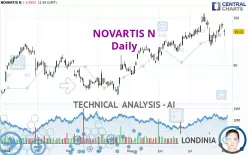
NOVARTIS N - Daily - Technical analysis published on 12/20/2024 (GMT)
- 100
- 0
Click here for a new analysis!
- Timeframe : Daily
- - Analysis generated on
- Status : INVALID

Summary of the analysis

Additional analysis
Quotes
NOVARTIS N rating 86.44 CHF. On the day, this instrument lost -0.69% and was between 86.04 CHF and 86.81 CHF. This implies that the price is at +0.46% from its lowest and at -0.43% from its highest.The Central Gaps scanner detects the formation of a bearish gap marking the strong presence of sellers ahead of buyers at the opening. This formed a quotation gap.
Opening Gap DOWN
Type : Bearish
Timeframe : Openning
A study of price movements over other periods shows the following variations:
Near a new LOW record (1st january)
Type : Bearish
Timeframe : Weekly
New LOW record (1 month)
Type : Bearish
Timeframe : Weekly
Technical
A technical analysis in Daily of this NOVARTIS N chart shows a sharp bearish trend. 92.86% of the signals given by moving averages are bearish. The overall trend is supported by the strong bearish signals from short-term moving averages. The Central Indicators market scanner currently does not detect any result that concerns moving averages.
In fact, of the 18 technical indicators analysed by Central Analyzer, 4 are bullish, 1 are neutral and 13 are bearish. Caution: the Central Indicators scanner currently detects an excess:
RSI indicator is oversold : under 30
Type : Neutral
Timeframe : Daily
CCI indicator is oversold : under -100
Type : Neutral
Timeframe : Daily
Williams %R indicator is oversold : under -80
Type : Neutral
Timeframe : Daily
Pivot points : price is under support 1
Type : Neutral
Timeframe : Daily
Pivot points : price is under support 1
Type : Neutral
Timeframe : Weekly
An analysis of the price chart with the Central Patterns scanner (detector of chart patterns and resistances and supports) shows several results that can have an impact on the price change:
Near horizontal support
Type : Bullish
Timeframe : Daily
Support of channel is broken
Type : Bearish
Timeframe : Daily
The Central Candlesticks scanner which studies Japanese candlesticks did not detect anything.
| S3 | S2 | S1 | Price | R1 | R2 | R3 | |
|---|---|---|---|---|---|---|---|
| ProTrendLines | 76.87 | 81.19 | 84.52 | 86.44 | 86.61 | 90.39 | 93.29 |
| Change (%) | -11.07% | -6.07% | -2.22% | - | +0.20% | +4.57% | +7.92% |
| Change | -9.57 | -5.25 | -1.92 | - | +0.17 | +3.95 | +6.85 |
| Level | Minor | Major | Major | - | Intermediate | Major | Major |
Pivot points can also be used to set your price objectives. Here is the price situation in relation to pivot points:
| Pivot points | S3 | S2 | S1 | PP | R1 | R2 | R3 |
|---|---|---|---|---|---|---|---|
| Standard | 85.30 | 86.07 | 86.56 | 87.33 | 87.82 | 88.59 | 89.08 |
| Camarilla | 86.69 | 86.81 | 86.93 | 87.04 | 87.16 | 87.27 | 87.39 |
| Woodie | 85.15 | 86.00 | 86.41 | 87.26 | 87.67 | 88.52 | 88.93 |
| Fibonacci | 86.07 | 86.56 | 86.85 | 87.33 | 87.82 | 88.11 | 88.59 |
| Pivot points | S3 | S2 | S1 | PP | R1 | R2 | R3 |
|---|---|---|---|---|---|---|---|
| Standard | 83.54 | 85.33 | 86.53 | 88.32 | 89.52 | 91.31 | 92.51 |
| Camarilla | 86.92 | 87.19 | 87.47 | 87.74 | 88.01 | 88.29 | 88.56 |
| Woodie | 83.26 | 85.18 | 86.25 | 88.17 | 89.24 | 91.16 | 92.23 |
| Fibonacci | 85.33 | 86.47 | 87.17 | 88.32 | 89.46 | 90.16 | 91.31 |
| Pivot points | S3 | S2 | S1 | PP | R1 | R2 | R3 |
|---|---|---|---|---|---|---|---|
| Standard | 83.99 | 87.03 | 90.15 | 93.19 | 96.31 | 99.35 | 102.47 |
| Camarilla | 91.58 | 92.14 | 92.71 | 93.27 | 93.84 | 94.40 | 94.96 |
| Woodie | 84.03 | 87.05 | 90.19 | 93.21 | 96.35 | 99.37 | 102.51 |
| Fibonacci | 87.03 | 89.38 | 90.84 | 93.19 | 95.54 | 97.00 | 99.35 |
Numerical data
The following is the status of technical indicators and moving averages registered at the time this technical analysis was created:
| RSI (14): | 26.98 | |
| MACD (12,26,9): | -1.7400 | |
| Directional Movement: | -32.71 | |
| AROON (14): | -100.00 | |
| DEMA (21): | 87.23 | |
| Parabolic SAR (0,02-0,02-0,2): | 89.84 | |
| Elder Ray (13): | -2.38 | |
| Super Trend (3,10): | 89.74 | |
| Zig ZAG (10): | 86.35 | |
| VORTEX (21): | 0.7900 | |
| Stochastique (14,3,5): | 9.09 | |
| TEMA (21): | 86.86 | |
| Williams %R (14): | -95.38 | |
| Chande Momentum Oscillator (20): | -3.74 | |
| Repulse (5,40,3): | 0.0600 | |
| ROCnROLL: | 2 | |
| TRIX (15,9): | -0.2400 | |
| Courbe Coppock: | 10.14 |
| MA7: | 87.72 | |
| MA20: | 90.35 | |
| MA50: | 93.62 | |
| MA100: | 96.02 | |
| MAexp7: | 87.72 | |
| MAexp20: | 89.49 | |
| MAexp50: | 92.26 | |
| MAexp100: | 93.86 | |
| Price / MA7: | -1.46% | |
| Price / MA20: | -4.33% | |
| Price / MA50: | -7.67% | |
| Price / MA100: | -9.98% | |
| Price / MAexp7: | -1.46% | |
| Price / MAexp20: | -3.41% | |
| Price / MAexp50: | -6.31% | |
| Price / MAexp100: | -7.91% |
News
The latest news and videos published on NOVARTIS N at the time of the analysis were as follows:
- BioAge Labs Announces Multi-Year Collaboration with Novartis to Discover Novel Targets for Therapies that Address Age-Related Diseases and Conditions
- PTC Therapeutics Enters into a Global License and Collaboration Agreement with Novartis for PTC518 Huntington's Disease Program
- Ratio Enters License and Collaboration Agreement with Novartis for SSTR2-targeting Radiotherapeutic Candidate
- Novartis receives positive CHMP opinion for Kisqali® to help reduce risk of recurrence in people with HR+/HER2- early breast cancer
- From Novartis Day of Service to Board Leadership: The Impact on Students 2 Science
About author
Online


Add a comment
Comments
0 comments on the analysis NOVARTIS N - Daily