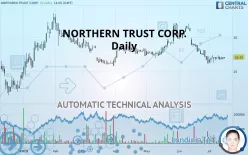
NORTHERN TRUST CORP. - Daily - Technical analysis published on 07/16/2019 (GMT)
- 332
- 0
- Who voted?
Click here for a new analysis!
- Timeframe : Daily
- - Analysis generated on
- Status : INVALID

Summary of the analysis

Additional analysis
Quotes
The NORTHERN TRUST CORP. price is 25.42 USD. On the day, this instrument gained +0.04% and was between 25.38 USD and 25.42 USD. This implies that the price is at +0.16% from its lowest and at 0% from its highest.The Central Gaps scanner detects a bearish opening. A small advantage for sellers in the very short term.
Bearish opening
Type : Bearish
Timeframe : Openning
So that you have an overall view of the price change, here is a table showing the variations over several periods:
Near a new LOW record (1 year)
Type : Bearish
Timeframe : Weekly
Near a new LOW record (1st january)
Type : Bearish
Timeframe : Weekly
Technical
Technical analysis of this Daily chart of NORTHERN TRUST CORP. indicates that the overall trend is strongly bearish. 89.29% of the signals given by moving averages are bearish. The overall trend is supported by the strong bearish signals from short-term moving averages. The Central Indicators market scanner currently does not detect any result that concerns moving averages.
On the 18 technical indicators analysed, 6 are bullish, 7 are neutral and 5 are bearish. But beware of excesses. The Central Indicators scanner currently detects this:
Williams %R indicator is overbought : over -20
Type : Neutral
Timeframe : Daily
Price is back over the pivot point
Type : Bullish
Timeframe : Daily
The Central Patterns scanner, which studies chart patterns, resistances and supports, has identified this signal:
Near horizontal resistance
Type : Bearish
Timeframe : Daily
The Central Candlesticks scanner which studies Japanese candlesticks did not detect anything.
| S3 | S2 | S1 | Price | R1 | R2 | R3 | |
|---|---|---|---|---|---|---|---|
| ProTrendLines | 24.40 | 24.87 | 25.17 | 25.42 | 25.44 | 25.68 | 26.37 |
| Change (%) | -4.01% | -2.16% | -0.98% | - | +0.08% | +1.02% | +3.74% |
| Change | -1.02 | -0.55 | -0.25 | - | +0.02 | +0.26 | +0.95 |
| Level | Intermediate | Minor | Major | - | Major | Major | Major |
Pivot points can also be used to set your price objectives. Here is the price situation in relation to pivot points:
| Pivot points | S3 | S2 | S1 | PP | R1 | R2 | R3 |
|---|---|---|---|---|---|---|---|
| Standard | 25.32 | 25.34 | 25.38 | 25.40 | 25.43 | 25.45 | 25.49 |
| Camarilla | 25.40 | 25.40 | 25.41 | 25.41 | 25.42 | 25.42 | 25.43 |
| Woodie | 25.33 | 25.35 | 25.38 | 25.40 | 25.44 | 25.46 | 25.49 |
| Fibonacci | 25.34 | 25.36 | 25.38 | 25.40 | 25.42 | 25.43 | 25.45 |
| Pivot points | S3 | S2 | S1 | PP | R1 | R2 | R3 |
|---|---|---|---|---|---|---|---|
| Standard | 25.15 | 25.24 | 25.30 | 25.39 | 25.45 | 25.53 | 25.59 |
| Camarilla | 25.32 | 25.33 | 25.35 | 25.36 | 25.37 | 25.39 | 25.40 |
| Woodie | 25.14 | 25.23 | 25.29 | 25.38 | 25.43 | 25.52 | 25.58 |
| Fibonacci | 25.24 | 25.30 | 25.33 | 25.39 | 25.44 | 25.48 | 25.53 |
| Pivot points | S3 | S2 | S1 | PP | R1 | R2 | R3 |
|---|---|---|---|---|---|---|---|
| Standard | 23.68 | 24.46 | 24.84 | 25.62 | 26.00 | 26.78 | 27.16 |
| Camarilla | 24.91 | 25.02 | 25.12 | 25.23 | 25.34 | 25.44 | 25.55 |
| Woodie | 23.49 | 24.36 | 24.65 | 25.52 | 25.81 | 26.68 | 26.97 |
| Fibonacci | 24.46 | 24.90 | 25.17 | 25.62 | 26.06 | 26.33 | 26.78 |
Numerical data
The following are the details of the technical indicators and moving averages that were collected to generate this technical analysis:
| RSI (14): | 42.86 | |
| MACD (12,26,9): | -0.1000 | |
| Directional Movement: | -10.24 | |
| AROON (14): | -21.43 | |
| DEMA (21): | 25.34 | |
| Parabolic SAR (0,02-0,02-0,2): | 25.25 | |
| Elder Ray (13): | -0.02 | |
| Super Trend (3,10): | 25.72 | |
| Zig ZAG (10): | 25.42 | |
| VORTEX (21): | 0.8200 | |
| Stochastique (14,3,5): | 40.07 | |
| TEMA (21): | 25.28 | |
| Williams %R (14): | -57.28 | |
| Chande Momentum Oscillator (20): | 0.05 | |
| Repulse (5,40,3): | -0.0700 | |
| ROCnROLL: | 2 | |
| TRIX (15,9): | -0.0700 | |
| Courbe Coppock: | 1.07 |
| MA7: | 25.39 | |
| MA20: | 25.43 | |
| MA50: | 25.70 | |
| MA100: | 25.62 | |
| MAexp7: | 25.39 | |
| MAexp20: | 25.48 | |
| MAexp50: | 25.60 | |
| MAexp100: | 25.64 | |
| Price / MA7: | +0.12% | |
| Price / MA20: | -0.04% | |
| Price / MA50: | -1.09% | |
| Price / MA100: | -0.78% | |
| Price / MAexp7: | +0.12% | |
| Price / MAexp20: | -0.24% | |
| Price / MAexp50: | -0.70% | |
| Price / MAexp100: | -0.86% |
About author

Online


Add a comment
Comments
0 comments on the analysis NORTHERN TRUST CORP. - Daily