| Open: | - |
| Change: | - |
| Volume: | - |
| Low: | - |
| High: | - |
| High / Low range: | - |
| Type: | ETF |
| Ticker: | NTRS |
| ISIN: |
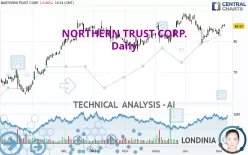
NORTHERN TRUST CORP. - Daily - Technical analysis published on 05/07/2024 (GMT)
- 176
- 0
- 05/07/2024 - 19:30
Click here for a new analysis!
- Timeframe : Daily
- - Analysis generated on 05/07/2024 - 19:30
- Status : LEVEL MAINTAINED

Summary of the analysis

Additional analysis
Quotes
The NORTHERN TRUST CORP. price is 84.97 USD. The price registered a decrease of -0.06% on the session with the lowest point at 84.82 USD and the highest point at 85.74 USD. The deviation from the price is +0.18% for the low point and -0.90% for the high point.A bullish gap was detected at the opening by the Central Gaps scanner. There are a lot of buyers and they have the upper hand in the very short term.
Opening Gap UP
Type : Bullish
Timeframe : Openning
Here is a more detailed summary of the historical variations registered by NORTHERN TRUST CORP.:
Near a new HIGH record (1 year)
Type : Bullish
Timeframe : Weekly
Near a new HIGH record (1st january)
Type : Bullish
Timeframe : Weekly
Near a new HIGH record (1 month)
Type : Bullish
Timeframe : Weekly
Technical
Technical analysis of this Daily chart of NORTHERN TRUST CORP. indicates that the overall trend is strongly bullish. 85.71% of the signals given by moving averages are bullish. The slightly bullish signals given by the short-term moving averages show a weakening of the global trend. The Central Indicators market scanner currently does not detect any result that concerns moving averages.
In fact, 13 technical indicators on 18 studied are currently positioned bullish. But beware of excesses. The Central Indicators scanner currently detects this:
CCI indicator is overbought : over 100
Type : Neutral
Timeframe : Daily
Williams %R indicator is overbought : over -20
Type : Neutral
Timeframe : Daily
MACD indicator is back over 0
Type : Bullish
Timeframe : Daily
Price is back under the pivot point
Type : Bearish
Timeframe : Daily
An analysis of the price chart with the Central Patterns scanner (detector of chart patterns and resistances and supports) shows several results that can have an impact on the price change:
Near horizontal resistance
Type : Bearish
Timeframe : Daily
Near resistance of channel
Type : Bearish
Timeframe : Daily
No result was found by the Central Candlesticks scanner on Japanese candlesticks.
| S3 | S2 | S1 | Price | R1 | R2 | R3 | |
|---|---|---|---|---|---|---|---|
| ProTrendLines | 67.20 | 72.95 | 79.53 | 84.97 | 85.39 | 88.92 | 95.74 |
| Change (%) | -20.91% | -14.15% | -6.40% | - | +0.49% | +4.65% | +12.68% |
| Change | -17.77 | -12.02 | -5.44 | - | +0.42 | +3.95 | +10.77 |
| Level | Minor | Major | Major | - | Major | Major | Intermediate |
Attention could also be paid to pivot points to set price objectives:
| Pivot points | S3 | S2 | S1 | PP | R1 | R2 | R3 |
|---|---|---|---|---|---|---|---|
| Standard | 83.55 | 83.99 | 84.50 | 84.94 | 85.45 | 85.89 | 86.40 |
| Camarilla | 84.76 | 84.85 | 84.93 | 85.02 | 85.11 | 85.19 | 85.28 |
| Woodie | 83.60 | 84.01 | 84.55 | 84.96 | 85.50 | 85.91 | 86.45 |
| Fibonacci | 83.99 | 84.35 | 84.57 | 84.94 | 85.30 | 85.52 | 85.89 |
| Pivot points | S3 | S2 | S1 | PP | R1 | R2 | R3 |
|---|---|---|---|---|---|---|---|
| Standard | 79.95 | 80.97 | 82.80 | 83.82 | 85.65 | 86.67 | 88.50 |
| Camarilla | 83.84 | 84.10 | 84.36 | 84.62 | 84.88 | 85.14 | 85.40 |
| Woodie | 80.35 | 81.17 | 83.20 | 84.02 | 86.05 | 86.87 | 88.90 |
| Fibonacci | 80.97 | 82.06 | 82.74 | 83.82 | 84.91 | 85.59 | 86.67 |
| Pivot points | S3 | S2 | S1 | PP | R1 | R2 | R3 |
|---|---|---|---|---|---|---|---|
| Standard | 68.22 | 73.77 | 78.08 | 83.63 | 87.94 | 93.49 | 97.80 |
| Camarilla | 79.68 | 80.58 | 81.49 | 82.39 | 83.29 | 84.20 | 85.10 |
| Woodie | 67.60 | 73.46 | 77.46 | 83.32 | 87.32 | 93.18 | 97.18 |
| Fibonacci | 73.77 | 77.54 | 79.86 | 83.63 | 87.40 | 89.72 | 93.49 |
Numerical data
The following is the status of the technical indicators and moving averages at the time of publication of this technical analysis:
| RSI (14): | 54.73 | |
| MACD (12,26,9): | 0.0400 | |
| Directional Movement: | -0.70 | |
| AROON (14): | 100.00 | |
| DEMA (21): | 83.96 | |
| Parabolic SAR (0,02-0,02-0,2): | 79.98 | |
| Elder Ray (13): | 1.33 | |
| Super Trend (3,10): | 87.66 | |
| Zig ZAG (10): | 84.95 | |
| VORTEX (21): | 0.8800 | |
| Stochastique (14,3,5): | 89.89 | |
| TEMA (21): | 83.74 | |
| Williams %R (14): | -15.97 | |
| Chande Momentum Oscillator (20): | 3.50 | |
| Repulse (5,40,3): | -0.9500 | |
| ROCnROLL: | 1 | |
| TRIX (15,9): | -0.0400 | |
| Courbe Coppock: | 2.64 |
| MA7: | 83.87 | |
| MA20: | 83.37 | |
| MA50: | 83.88 | |
| MA100: | 82.56 | |
| MAexp7: | 84.19 | |
| MAexp20: | 83.93 | |
| MAexp50: | 83.40 | |
| MAexp100: | 81.59 | |
| Price / MA7: | +1.31% | |
| Price / MA20: | +1.92% | |
| Price / MA50: | +1.30% | |
| Price / MA100: | +2.92% | |
| Price / MAexp7: | +0.93% | |
| Price / MAexp20: | +1.24% | |
| Price / MAexp50: | +1.88% | |
| Price / MAexp100: | +4.14% |
News
Don't forget to follow the news on NORTHERN TRUST CORP.. At the time of publication of this analysis, the latest news was as follows:
- 02/26/2020 - 09:00 Northern Trust Grows UK Pension Assets Under Custody by More Than US$72 Billion in 2019
- 01/09/2020 - 09:54 Northern Trust Asset Management Launches Sustainable Quantitative Solutions
- 12/18/2019 - 09:00 Northern Trust Selected by Storebrand as Asset Servicing Provider for Cross-Border Distribution Through New Luxembourg Fund Range
- 12/17/2019 - 15:00 Northern Trust Enhances Collateral Management Services to Help Clients Optimize Performance and Meet Margin Obligations
- 09/25/2019 - 08:00 Northern Trust Bolsters Institutional Sales and Product Management Teams
About author
Online


Add a comment
Comments
0 comments on the analysis NORTHERN TRUST CORP. - Daily