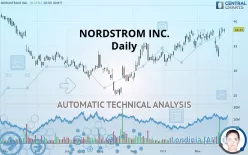
NORDSTROM INC. - Daily - Technical analysis published on 11/29/2019 (GMT)
- 312
- 0
- Who voted?
Click here for a new analysis!
- Timeframe : Daily
- - Analysis generated on
- Status : INVALID

Summary of the analysis

Additional analysis
Quotes
The NORDSTROM INC. rating is 38.32 USD. The price registered an increase of +0.37% on the session and was traded between 37.67 USD and 38.55 USD over the period. The price is currently at +1.73% from its lowest and -0.60% from its highest.The Central Gaps scanner detects a bearish opening marking the presence of sellers ahead of buyers at the opening but not sufficiently marked to allow the price to register a quotation gap.
Bearish opening
Type : Bearish
Timeframe : Openning
Here is a more detailed summary of the historical variations registered by NORDSTROM INC.:
Near a new HIGH record (1 month)
Type : Bullish
Timeframe : Weekly
Abnormal volumes on NORDSTROM INC. were detected by the Central Volumes scanner:
Abnormal volumes
Timeframe : 5 days
Technical
A technical analysis in Daily of this NORDSTROM INC. chart shows a strongly bullish trend. 92.86% of the signals given by moving averages are bullish. This strongly bullish trend is supported by the strong bullish signals given by short-term moving averages. The Central Indicators market scanner currently does not detect any result that concerns moving averages.
An assessment of technical indicators shows a strong bullish signal.
Caution: the Central Indicators scanner currently detects an excess:
CCI indicator is overbought : over 100
Type : Neutral
Timeframe : Daily
Williams %R indicator is overbought : over -20
Type : Neutral
Timeframe : Daily
MACD crosses UP its Moving Average
Type : Bullish
Timeframe : Daily
An analysis of the price chart with the Central Patterns scanner (detector of chart patterns and resistances and supports) shows several results that can have an impact on the price change:
Near horizontal resistance
Type : Bearish
Timeframe : Daily
Resistance of channel is broken
Type : Bullish
Timeframe : Daily
Central Candlesticks, the scanner specialised in Japanese candlesticks, detects a bullish signal that could support the hypothesis of a small rebound in the very short term:
Bullish engulfing lines
Type : Bullish
Timeframe : Daily
| S3 | S2 | S1 | Price | R1 | R2 | R3 | |
|---|---|---|---|---|---|---|---|
| ProTrendLines | 28.78 | 33.21 | 38.30 | 38.32 | 40.62 | 43.93 | 45.68 |
| Change (%) | -24.90% | -13.34% | -0.05% | - | +6.00% | +14.64% | +19.21% |
| Change | -9.54 | -5.11 | -0.02 | - | +2.30 | +5.61 | +7.36 |
| Level | Major | Intermediate | Major | - | Minor | Minor | Intermediate |
Pivot points can also be used to set your price objectives. Here is the price situation in relation to pivot points:
| Pivot points | S3 | S2 | S1 | PP | R1 | R2 | R3 |
|---|---|---|---|---|---|---|---|
| Standard | 36.72 | 37.22 | 37.70 | 38.21 | 38.69 | 39.19 | 39.67 |
| Camarilla | 37.91 | 38.00 | 38.09 | 38.18 | 38.27 | 38.36 | 38.45 |
| Woodie | 36.70 | 37.21 | 37.69 | 38.20 | 38.67 | 39.18 | 39.66 |
| Fibonacci | 37.22 | 37.60 | 37.83 | 38.21 | 38.58 | 38.81 | 39.19 |
| Pivot points | S3 | S2 | S1 | PP | R1 | R2 | R3 |
|---|---|---|---|---|---|---|---|
| Standard | 28.25 | 30.32 | 33.95 | 36.02 | 39.66 | 41.73 | 45.36 |
| Camarilla | 36.01 | 36.54 | 37.06 | 37.58 | 38.11 | 38.63 | 39.15 |
| Woodie | 29.03 | 30.71 | 34.73 | 36.41 | 40.43 | 42.12 | 46.14 |
| Fibonacci | 30.32 | 32.50 | 33.85 | 36.02 | 38.20 | 39.55 | 41.73 |
| Pivot points | S3 | S2 | S1 | PP | R1 | R2 | R3 |
|---|---|---|---|---|---|---|---|
| Standard | 24.32 | 27.47 | 31.51 | 34.66 | 38.70 | 41.85 | 45.89 |
| Camarilla | 33.58 | 34.23 | 34.89 | 35.55 | 36.21 | 36.87 | 37.53 |
| Woodie | 24.77 | 27.69 | 31.96 | 34.88 | 39.15 | 42.07 | 46.34 |
| Fibonacci | 27.47 | 30.22 | 31.91 | 34.66 | 37.41 | 39.10 | 41.85 |
Numerical data
The following is the status of technical indicators and moving averages registered at the time this technical analysis was created:
| RSI (14): | 60.40 | |
| MACD (12,26,9): | 0.6500 | |
| Directional Movement: | 6.51 | |
| AROON (14): | 21.43 | |
| DEMA (21): | 37.42 | |
| Parabolic SAR (0,02-0,02-0,2): | 32.99 | |
| Elder Ray (13): | 1.25 | |
| Super Trend (3,10): | 33.45 | |
| Zig ZAG (10): | 38.32 | |
| VORTEX (21): | 0.9600 | |
| Stochastique (14,3,5): | 93.47 | |
| TEMA (21): | 37.29 | |
| Williams %R (14): | -6.17 | |
| Chande Momentum Oscillator (20): | 1.25 | |
| Repulse (5,40,3): | 3.5800 | |
| ROCnROLL: | 1 | |
| TRIX (15,9): | 0.2300 | |
| Courbe Coppock: | 2.98 |
| MA7: | 36.40 | |
| MA20: | 36.59 | |
| MA50: | 34.94 | |
| MA100: | 32.25 | |
| MAexp7: | 37.25 | |
| MAexp20: | 36.54 | |
| MAexp50: | 35.14 | |
| MAexp100: | 34.34 | |
| Price / MA7: | +5.27% | |
| Price / MA20: | +4.73% | |
| Price / MA50: | +9.67% | |
| Price / MA100: | +18.82% | |
| Price / MAexp7: | +2.87% | |
| Price / MAexp20: | +4.87% | |
| Price / MAexp50: | +9.05% | |
| Price / MAexp100: | +11.59% |
News
The latest news and videos published on NORDSTROM INC. at the time of the analysis were as follows:
-
 What Investors Need to Know About Nordstrom, Disney and Tesla
- Nordstrom Kicks Off The Season Of Giving
- Nordstrom Expands In New York City With Opening Of Flagship Store
- Nordstrom Partners With Good+Foundation To Help New York City Families In Need
- Nordstrom Opens Its Doors At The SoNo Collection In Norwalk, CT
About author

Online


Add a comment
Comments
0 comments on the analysis NORDSTROM INC. - Daily