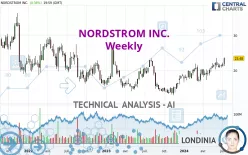
NORDSTROM INC. - Weekly - Technical analysis published on 07/13/2024 (GMT)
- 150
- 0
Click here for a new analysis!
- Timeframe : Weekly
- - Analysis generated on
- Status : TARGET REACHED

Summary of the analysis

Additional analysis
Quotes
NORDSTROM INC. rating 23.48 USD. The price is up +7.56% over 5 days and has been traded over the last 5 days between 21.33 USD and 23.74 USD. This implies that the 5 day price is +10.08% from its lowest point and -1.10% from its highest point.A bullish gap was detected at the opening by the Central Gaps scanner. There are a lot of buyers and they have the upper hand in the very short term.
Opening Gap UP
Type : Bullish
Timeframe : Openning
A study of price movements over other periods shows the following variations:
New HIGH record (1 year)
Type : Bullish
Timeframe : Weekly
New HIGH record (1st january)
Type : Bullish
Timeframe : Weekly
New HIGH record (1 month)
Type : Bullish
Timeframe : Weekly
Technical
Technical analysis of this Weekly chart of NORDSTROM INC. indicates that the overall trend is strongly bullish. 89.29% of the signals given by moving averages are bullish. This strongly bullish trend is supported by the strong bullish signals given by short-term moving averages. The Central Indicators scanner detects a bullish signal on moving averages that could impact this trend:
Moving Average bullish crossovers : AMA20 & AMA50
Type : Bullish
Timeframe : Weekly
Technical indicators are strongly bullish, suggesting that the price increase should continue.
Caution: the Central Indicators scanner currently detects an excess:
CCI indicator is overbought : over 100
Type : Neutral
Timeframe : Weekly
Williams %R indicator is overbought : over -20
Type : Neutral
Timeframe : Weekly
Pivot points : price is over resistance 3
Type : Neutral
Timeframe : Weekly
The analysis of the price chart with Central Patterns scanners does not return any result.
The Central Candlesticks scanner, specialised in Japanese candlesticks, did not identify any signals.
| S3 | S2 | S1 | Price | R1 | R2 | R3 | |
|---|---|---|---|---|---|---|---|
| ProTrendLines | 10.78 | 17.87 | 21.27 | 23.48 | 24.95 | 28.93 | 31.97 |
| Change (%) | -54.09% | -23.89% | -9.41% | - | +6.26% | +23.21% | +36.16% |
| Change | -12.70 | -5.61 | -2.21 | - | +1.47 | +5.45 | +8.49 |
| Level | Major | Intermediate | Major | - | Intermediate | Intermediate | Minor |
Attention could also be paid to pivot points to set price objectives:
| Pivot points | S3 | S2 | S1 | PP | R1 | R2 | R3 |
|---|---|---|---|---|---|---|---|
| Standard | 22.48 | 22.79 | 23.13 | 23.44 | 23.78 | 24.09 | 24.43 |
| Camarilla | 23.30 | 23.36 | 23.42 | 23.48 | 23.54 | 23.60 | 23.66 |
| Woodie | 22.51 | 22.80 | 23.16 | 23.45 | 23.81 | 24.10 | 24.46 |
| Fibonacci | 22.79 | 23.04 | 23.19 | 23.44 | 23.69 | 23.84 | 24.09 |
| Pivot points | S3 | S2 | S1 | PP | R1 | R2 | R3 |
|---|---|---|---|---|---|---|---|
| Standard | 20.10 | 20.60 | 21.21 | 21.71 | 22.32 | 22.82 | 23.43 |
| Camarilla | 21.53 | 21.63 | 21.73 | 21.83 | 21.93 | 22.03 | 22.14 |
| Woodie | 20.17 | 20.63 | 21.28 | 21.74 | 22.39 | 22.85 | 23.50 |
| Fibonacci | 20.60 | 21.02 | 21.28 | 21.71 | 22.13 | 22.39 | 22.82 |
| Pivot points | S3 | S2 | S1 | PP | R1 | R2 | R3 |
|---|---|---|---|---|---|---|---|
| Standard | 17.53 | 19.12 | 20.17 | 21.76 | 22.81 | 24.40 | 25.45 |
| Camarilla | 20.49 | 20.74 | 20.98 | 21.22 | 21.46 | 21.70 | 21.95 |
| Woodie | 17.26 | 18.99 | 19.90 | 21.63 | 22.54 | 24.27 | 25.18 |
| Fibonacci | 19.12 | 20.13 | 20.75 | 21.76 | 22.77 | 23.39 | 24.40 |
Numerical data
The following is the status of technical indicators and moving averages registered at the time this technical analysis was created:
| RSI (14): | 68.26 | |
| MACD (12,26,9): | 1.2100 | |
| Directional Movement: | 16.95 | |
| AROON (14): | 85.71 | |
| DEMA (21): | 22.00 | |
| Parabolic SAR (0,02-0,02-0,2): | 18.66 | |
| Elder Ray (13): | 1.38 | |
| Super Trend (3,10): | 17.52 | |
| Zig ZAG (10): | 23.48 | |
| VORTEX (21): | 1.0800 | |
| Stochastique (14,3,5): | 79.38 | |
| TEMA (21): | 22.54 | |
| Williams %R (14): | -3.82 | |
| Chande Momentum Oscillator (20): | 4.72 | |
| Repulse (5,40,3): | 11.3000 | |
| ROCnROLL: | 1 | |
| TRIX (15,9): | 0.8400 | |
| Courbe Coppock: | 32.57 |
| MA7: | 22.21 | |
| MA20: | 21.65 | |
| MA50: | 21.25 | |
| MA100: | 20.09 | |
| MAexp7: | 21.81 | |
| MAexp20: | 20.47 | |
| MAexp50: | 19.03 | |
| MAexp100: | 19.05 | |
| Price / MA7: | +5.72% | |
| Price / MA20: | +8.45% | |
| Price / MA50: | +10.49% | |
| Price / MA100: | +16.87% | |
| Price / MAexp7: | +7.66% | |
| Price / MAexp20: | +14.70% | |
| Price / MAexp50: | +23.38% | |
| Price / MAexp100: | +23.25% |
News
The last news published on NORDSTROM INC. at the time of the generation of this analysis was as follows:
- Nordstrom Rack to Open New Location in Coral Springs, Florida
- NORDSTROM ANNIVERSARY SALE STARTS ON JULY 15
- Nordstrom Rack to Open New Location in Houston
- Nordstrom Rack to Open New Location in Tarzana, California
- Nordstrom Reports First Quarter 2024 Earnings
About author

Online


Add a comment
Comments
0 comments on the analysis NORDSTROM INC. - Weekly