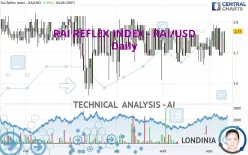
RAI REFLEX INDEX - RAI/USD overview
RAI REFLEX INDEX - RAI/USD
> Analyses

 Thank you
Reply
Chart
Thank you
Reply
Chart
Londinia
has published a new analysis.
- 0
- 91684
- 15625
- 0
Timeframe : Daily - Simple chart
Status : NEUTRAL
The basic trend is slightly bearish and the short term is tentatively bullish. With such a pattern, it is difficult to favour buying or selling. The first resistance is located at 2.78 USD. The first…
RAI REFLEX INDEX - RAI/USD
> Analyses
 Thank you
Reply
Chart
Thank you
Reply
Chart
Londinia
has published a new analysis.
- 0
- 91684
- 15625
- 0
Timeframe : Daily - Simple chart
Status : INVALID
A bullish trend on RAI REFLEX INDEX - RAI/USD both in substance and in the short term. A purchase could be considered as long as the price remains above 2.71 USD. Each resistance break is a strong…
RAI REFLEX INDEX - RAI/USD
> Analyses
 Thank you
Reply
Chart
Thank you
Reply
Chart
Londinia
has published a new analysis.
- 0
- 91684
- 15625
- 0
Timeframe : Daily - Simple chart
Status : NEUTRAL
A slightly bearish trend and a neutral short term. With such a pattern, it is difficult to favour buying or selling. The first support is located at 2.71 USD. The first resistance is located at 2.81…
RAI REFLEX INDEX - RAI/USD
> Analyses
 Thank you
Reply
Chart
Thank you
Reply
Chart
Londinia
has published a new analysis.
- 0
- 91684
- 15625
- 0
Timeframe : Daily - Simple chart
Status : NEUTRAL
A slightly bearish trend and a neutral short term. With such a pattern, it is difficult to favour buying or selling. The first support is located at 2.60 USD. The first resistance is located at 2.78…

