NASDAQ FINANCIAL 100 INDEX overview
NASDAQ FINANCIAL 100 INDEX
> Analyses

 Thank you
Reply
Chart
Thank you
Reply
Chart
Londinia
has published a new analysis.
- 0
- 93474
- 15790
- 0
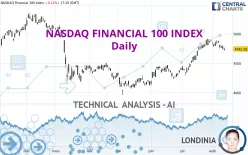
Timeframe : Daily - Simple chart
Status : INVALID
We are currently in a phase of short-term indecision. In a case like this, you could favour trades in the direction of the basic trend on NASDAQ FINANCIAL 100 INDEX. As long as you are above the…
NASDAQ FINANCIAL 100 INDEX
> Analyses
 Thank you
Reply
Chart
Thank you
Reply
Chart
Londinia
has published a new analysis.
- 0
- 93474
- 15790
- 0
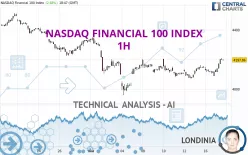
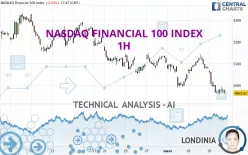
Timeframe : 1H - Simple chart
Status : TARGET REACHED
In the short term, there could be an acceleration of the basic bullish trend on NASDAQ FINANCIAL 100 INDEX. This is a positive signal for buyers. As long as the price remains above 4,106.25 USD, a…
NASDAQ FINANCIAL 100 INDEX
> Analyses
 Thank you
Reply
Chart
Thank you
Reply
Chart
Londinia
has published a new analysis.
- 0
- 93474
- 15790
- 0
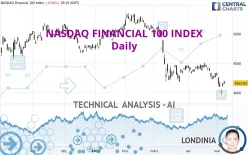
Timeframe : Daily - Simple chart
Status : INVALID
All elements being clearly bearish, it would be possible for traders to trade only short positions (for sale) on NASDAQ FINANCIAL 100 INDEX as long as the price remains well below 4,243.76 USD. The…
NASDAQ FINANCIAL 100 INDEX
> Analyses
 Thank you
Reply
Chart
Thank you
Reply
Chart
Londinia
has published a new analysis.
- 0
- 93474
- 15790
- 0
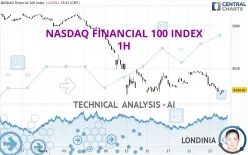
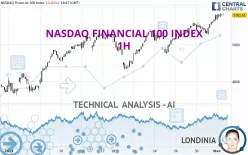
Timeframe : 1H - Simple chart
Status : INVALID
NASDAQ FINANCIAL 100 INDEX is part of a very strong bearish trend. Traders may consider trading only short positions (for sale) as long as the price remains well below 4,277.45 USD. The next support…
NASDAQ FINANCIAL 100 INDEX
> Analyses
 Thank you
Reply
Chart
Thank you
Reply
Chart
Londinia
has published a new analysis.
- 0
- 93474
- 15790
- 0
Timeframe : 1H - Simple chart
Status : TARGET REACHED
NASDAQ FINANCIAL 100 INDEX is part of a very strong bearish trend. Traders may consider trading only short positions (for sale) as long as the price remains well below 4,997.13 USD. The next support…
NASDAQ FINANCIAL 100 INDEX
> Analyses
 Thank you
Reply
Chart
Thank you
Reply
Chart
Londinia
has published a new analysis.
- 0
- 93474
- 15790
- 0
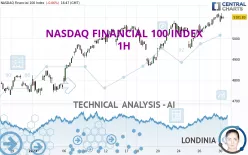
Timeframe : 1H - Simple chart
Status : TARGET REACHED
NASDAQ FINANCIAL 100 INDEX is part of a very strong bullish trend. Traders may consider trading only long positions (at the time of purchase) as long as the price remains well above 5,148.56 USD. The…
NASDAQ FINANCIAL 100 INDEX
> Analyses
 Thank you
Reply
Chart
Thank you
Reply
Chart
Londinia
has published a new analysis.
- 0
- 93474
- 15790
- 0
Timeframe : 1H - Simple chart
Status : TARGET REACHED
NASDAQ FINANCIAL 100 INDEX is part of a very strong bullish trend. Traders may consider trading only long positions (at the time of purchase) as long as the price remains well above 5,055.01 USD. The…
NASDAQ FINANCIAL 100 INDEX
> Analyses
 Thank you
Reply
Chart
Thank you
Reply
Chart
Londinia
has published a new analysis.
- 0
- 93474
- 15790
- 0
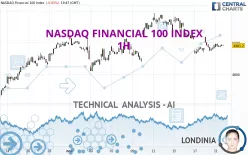
Timeframe : 1H - Simple chart
Status : INVALID
All elements being rather bearish, it would be possible for traders to trade only short positions (for sale) on NASDAQ FINANCIAL 100 INDEX as long as the price remains well below 5,047.46 USD. The…

