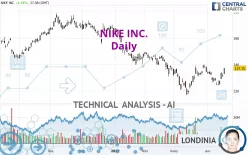
NIKE INC. - Daily - Technical analysis published on 04/19/2022 (GMT)
- 281
- 0
Click here for a new analysis!
- Timeframe : Daily
- - Analysis generated on
- Status : INVALID

Summary of the analysis

Additional analysis
Quotes
The NIKE INC. price is 137.15 USD. The price has increased by +4.19% since the last closing and was traded between 132.78 USD and 137.48 USD over the period. The price is currently at +3.29% from its lowest and -0.24% from its highest.The Central Gaps scanner detects a bullish opening marking the presence of buyers ahead of sellers at the opening but not sufficiently marked to allow the price to register a quotation gap.
Bullish opening
Type : Bullish
Timeframe : Openning
A study of price movements over other periods shows the following variations:
Near a new HIGH record (1 month)
Type : Bullish
Timeframe : Weekly
Technical
Technical analysis of NIKE INC. in Daily shows an overall slightly bearish trend. 57.14% of the signals given by moving averages are bearish. Caution: the strong bullish signals currently being given by short-term moving averages indicate that this slightly bearish trend could quickly be reversed. The Central Indicators market scanner is currently detecting several bullish signals that could impact this trend:
Bullish price crossover with Moving Average 20
Type : Bullish
Timeframe : Daily
Bullish price crossover with Moving Average 50
Type : Bullish
Timeframe : Daily
In fact, according to the parameters integrated into the Central Analyzer system, 12 technical indicators out of 18 analysed are currently bullish. Caution: the Central Indicators scanner currently detects an excess:
Williams %R indicator is overbought : over -20
Type : Neutral
Timeframe : Daily
Pivot points : price is over resistance 1
Type : Neutral
Timeframe : Weekly
Pivot points : price is over resistance 3
Type : Neutral
Timeframe : Daily
Parabolic SAR indicator bullish reversal
Type : Bullish
Timeframe : Daily
SuperTrend indicator bullish reversal
Type : Bullish
Timeframe : Daily
Momentum indicator is back over 0
Type : Bullish
Timeframe : Daily
An analysis of the price chart with the Central Patterns scanner (detector of chart patterns and resistances and supports) shows several results that can have an impact on the price change:
Near horizontal resistance
Type : Bearish
Timeframe : Daily
Resistance of channel is broken
Type : Bullish
Timeframe : Daily
The Central Candlesticks scanner which studies Japanese candlesticks did not detect anything.
| S3 | S2 | S1 | Price | R1 | R2 | R3 | |
|---|---|---|---|---|---|---|---|
| ProTrendLines | 102.55 | 117.57 | 126.11 | 137.15 | 139.01 | 145.60 | 156.79 |
| Change (%) | -25.23% | -14.28% | -8.05% | - | +1.36% | +6.16% | +14.32% |
| Change | -34.60 | -19.58 | -11.04 | - | +1.86 | +8.45 | +19.64 |
| Level | Intermediate | Major | Intermediate | - | Major | Intermediate | Intermediate |
Attention could also be paid to pivot points to set price objectives:
| Pivot points | S3 | S2 | S1 | PP | R1 | R2 | R3 |
|---|---|---|---|---|---|---|---|
| Standard | 127.08 | 128.70 | 130.16 | 131.78 | 133.24 | 134.86 | 136.32 |
| Camarilla | 130.78 | 131.07 | 131.35 | 131.63 | 131.91 | 132.20 | 132.48 |
| Woodie | 127.01 | 128.66 | 130.09 | 131.74 | 133.17 | 134.82 | 136.25 |
| Fibonacci | 128.70 | 129.87 | 130.60 | 131.78 | 132.95 | 133.68 | 134.86 |
| Pivot points | S3 | S2 | S1 | PP | R1 | R2 | R3 |
|---|---|---|---|---|---|---|---|
| Standard | 117.00 | 120.66 | 127.06 | 130.72 | 137.12 | 140.78 | 147.18 |
| Camarilla | 130.69 | 131.62 | 132.54 | 133.46 | 134.38 | 135.30 | 136.23 |
| Woodie | 118.37 | 121.35 | 128.43 | 131.41 | 138.49 | 141.47 | 148.55 |
| Fibonacci | 120.66 | 124.50 | 126.88 | 130.72 | 134.56 | 136.94 | 140.78 |
| Pivot points | S3 | S2 | S1 | PP | R1 | R2 | R3 |
|---|---|---|---|---|---|---|---|
| Standard | 97.81 | 107.28 | 120.92 | 130.39 | 144.03 | 153.50 | 167.14 |
| Camarilla | 128.21 | 130.32 | 132.44 | 134.56 | 136.68 | 138.80 | 140.92 |
| Woodie | 99.90 | 108.32 | 123.01 | 131.43 | 146.12 | 154.54 | 169.23 |
| Fibonacci | 107.28 | 116.11 | 121.56 | 130.39 | 139.22 | 144.67 | 153.50 |
Numerical data
The following are the details of the technical indicators and moving averages that were collected to generate this technical analysis:
| RSI (14): | 57.95 | |
| MACD (12,26,9): | -0.4300 | |
| Directional Movement: | 7.93 | |
| AROON (14): | -57.15 | |
| DEMA (21): | 130.41 | |
| Parabolic SAR (0,02-0,02-0,2): | 124.32 | |
| Elder Ray (13): | 3.87 | |
| Super Trend (3,10): | 122.98 | |
| Zig ZAG (10): | 137.19 | |
| VORTEX (21): | 1.0100 | |
| Stochastique (14,3,5): | 62.89 | |
| TEMA (21): | 132.02 | |
| Williams %R (14): | -17.28 | |
| Chande Momentum Oscillator (20): | 2.60 | |
| Repulse (5,40,3): | 5.7100 | |
| ROCnROLL: | 1 | |
| TRIX (15,9): | -0.0900 | |
| Courbe Coppock: | 5.68 |
| MA7: | 129.71 | |
| MA20: | 132.24 | |
| MA50: | 133.42 | |
| MA100: | 145.98 | |
| MAexp7: | 131.80 | |
| MAexp20: | 131.33 | |
| MAexp50: | 134.98 | |
| MAexp100: | 141.36 | |
| Price / MA7: | +5.74% | |
| Price / MA20: | +3.71% | |
| Price / MA50: | +2.80% | |
| Price / MA100: | -6.05% | |
| Price / MAexp7: | +4.06% | |
| Price / MAexp20: | +4.43% | |
| Price / MAexp50: | +1.61% | |
| Price / MAexp100: | -2.98% |
News
The latest news and videos published on NIKE INC. at the time of the analysis were as follows:
- Thinking about trading options or stock in Twitter, Bank of America, Exxon Mobil, Apple, or Nike?
-
 How Companies Like Amazon, Nike and FedEx Avoid Taxes
- Thinking about trading options or stock in Tesla, Dollar General, Pfizer, Nike, or Exxon Mobil?
- Thinking about trading options or stock in Alibaba, Nike, Baidu, Sea Ltd, or Tesla?
- NIKE, Inc. Reports Fiscal 2022 Third Quarter Results
About author

Online


Add a comment
Comments
0 comments on the analysis NIKE INC. - Daily