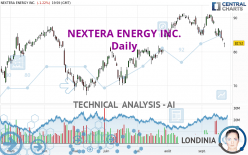
NEXTERA ENERGY INC. - Daily - Technical analysis published on 09/25/2022 (GMT)
- 187
- 0
I am delighted to see that my first price objective has been achieved. I hope you've taken advantage of it.
Click here for a new analysis!
Click here for a new analysis!
- Timeframe : Daily
- - Analysis generated on
- Status : TARGET REACHED

Summary of the analysis
Trends
Short term:
Strongly bearish
Underlying:
Neutral
Technical indicators
17%
78%
6%
My opinion
Bearish under 83.80 USD
My targets
80.26 USD (-2.74%)
77.08 USD (-6.59%)
My analysis
The current short-term bearish trend is expected to quickly fix the basic bearish trend. To avoid contradicting the short term, it would be possible to favour short positions (for sale) for NEXTERA ENERGY INC. as long as the price remains well below 83.80 USD. The sellers' bearish objective is set at 80.26 USD. A bearish break of this support would revive the bearish momentum. The sellers could then target the support located at 77.08 USD. If there is any crossing, the next objective would be the support located at 71.22 USD.
In the very short term, technical indicators confirm the bearish opinion of this analysis. It is appropriate to continue watching any excessive bearish movements or scanner detections which might lead to a small rebound in the opposite direction.
Force
0
10
3.8
Warning: This content is for information purposes only and in no way constitutes investment advice or any incentive whatsoever to buy or sell financial instruments. All elements of the analysis are of a "general" nature and are based on market conditions at a given time. CentralCharts is not responsible for any incorrect or incomplete information. Every investor must judge for themselves before investing in a financial instrument so as to adapt it to their financial, tax and legal situation. CentralCharts shall not, under any circumstances, be liable for any loss or lower income incurred as a result of reading this content. Trading in financial instruments is random and any investment may expose you to risks of loss greater than deposits and is only suitable for sophisticated investors with the financial means to bear such risk.

This analysis was given by Clay707. Take part yourself by sharing additional analysis on another time unit:
Additional analysis
Quotes
NEXTERA ENERGY INC. rating 82.52 USD. The price is lower by -1.22% since the last closing with the lowest point at 81.34 USD and the highest point at 82.67 USD. The deviation from the price is +1.45% for the low point and -0.18% for the high point.81.34
82.67
82.52
The Central Gaps scanner detects the formation of a bearish gap marking the strong presence of sellers ahead of buyers at the opening. This formed a quotation gap.
Opening Gap DOWN
Type : Bearish
Timeframe : Openning
So that you have an overall view of the price change, here is a table showing the variations over several periods:
New LOW record (1 month)
Type : Bearish
Timeframe : Weekly
Technical
Technical analysis of this Daily chart of NEXTERA ENERGY INC. indicates that the overall trend is not clearly defined. The trend could quickly turn bearish due to the strong bearish signals currently being given by short-term moving averages. There is no crossing of moving average by the price or crossing of moving averages between themselves.
In fact, according to the parameters integrated into the Central Analyzer system, 14 technical indicators out of 18 analysed are currently bearish. Caution: the Central Indicators scanner currently detects an excess:
CCI indicator is oversold : under -100
Type : Neutral
Timeframe : Daily
Williams %R indicator is oversold : under -80
Type : Neutral
Timeframe : Daily
Pivot points : price is under support 1
Type : Neutral
Timeframe : Daily
Pivot points : price is under support 1
Type : Neutral
Timeframe : Weekly
An analysis of the price chart with the Central Patterns scanner (detector of chart patterns and resistances and supports) shows a result that can have an impact on the price change:
Near horizontal resistance
Type : Bearish
Timeframe : Daily
Central Candlesticks, the scanner specialised in Japanese candlesticks, detects this inversion signal that could impact the current short-term trend:
Doji
Type : Neutral
Timeframe : Daily
ProTrendLines
S3
S2
S1
R1
R2
R3
Price
| S3 | S2 | S1 | Price | R1 | R2 | R3 | |
|---|---|---|---|---|---|---|---|
| ProTrendLines | 71.22 | 77.08 | 80.26 | 82.52 | 83.80 | 86.16 | 88.49 |
| Change (%) | -13.69% | -6.59% | -2.74% | - | +1.55% | +4.41% | +7.23% |
| Change | -11.30 | -5.44 | -2.26 | - | +1.28 | +3.64 | +5.97 |
| Level | Major | Minor | Minor | - | Intermediate | Minor | Minor |
To determine price objectives, it is also possible to use the pivot points. Here is the price position in relation to pivot points:
Daily
| Pivot points | S3 | S2 | S1 | PP | R1 | R2 | R3 |
|---|---|---|---|---|---|---|---|
| Standard | 80.35 | 80.85 | 81.68 | 82.18 | 83.01 | 83.51 | 84.34 |
| Camarilla | 82.15 | 82.28 | 82.40 | 82.52 | 82.64 | 82.76 | 82.89 |
| Woodie | 80.53 | 80.93 | 81.86 | 82.26 | 83.19 | 83.59 | 84.52 |
| Fibonacci | 80.85 | 81.36 | 81.67 | 82.18 | 82.69 | 83.00 | 83.51 |
Weekly
| Pivot points | S3 | S2 | S1 | PP | R1 | R2 | R3 |
|---|---|---|---|---|---|---|---|
| Standard | 74.71 | 78.03 | 80.27 | 83.59 | 85.83 | 89.15 | 91.39 |
| Camarilla | 80.99 | 81.50 | 82.01 | 82.52 | 83.03 | 83.54 | 84.05 |
| Woodie | 74.18 | 77.76 | 79.74 | 83.32 | 85.30 | 88.88 | 90.86 |
| Fibonacci | 78.03 | 80.15 | 81.46 | 83.59 | 85.71 | 87.02 | 89.15 |
Monthly
| Pivot points | S3 | S2 | S1 | PP | R1 | R2 | R3 |
|---|---|---|---|---|---|---|---|
| Standard | 74.09 | 78.62 | 81.84 | 86.37 | 89.59 | 94.12 | 97.34 |
| Camarilla | 82.93 | 83.64 | 84.35 | 85.06 | 85.77 | 86.48 | 87.19 |
| Woodie | 73.44 | 78.29 | 81.19 | 86.04 | 88.94 | 93.79 | 96.69 |
| Fibonacci | 78.62 | 81.58 | 83.41 | 86.37 | 89.33 | 91.16 | 94.12 |
Numerical data
The following is the status of the technical indicators and moving averages at the time of publication of this technical analysis:
Technical indicators
Moving averages
| RSI (14): | 37.25 | |
| MACD (12,26,9): | -0.6400 | |
| Directional Movement: | -14.85 | |
| AROON (14): | -78.57 | |
| DEMA (21): | 85.92 | |
| Parabolic SAR (0,02-0,02-0,2): | 89.28 | |
| Elder Ray (13): | -3.83 | |
| Super Trend (3,10): | 87.90 | |
| Zig ZAG (10): | 82.52 | |
| VORTEX (21): | 0.7900 | |
| Stochastique (14,3,5): | 6.26 | |
| TEMA (21): | 84.22 | |
| Williams %R (14): | -87.86 | |
| Chande Momentum Oscillator (20): | -7.72 | |
| Repulse (5,40,3): | -0.4500 | |
| ROCnROLL: | 2 | |
| TRIX (15,9): | 0.0200 | |
| Courbe Coppock: | 4.65 |
| MA7: | 84.77 | |
| MA20: | 86.82 | |
| MA50: | 85.85 | |
| MA100: | 80.25 | |
| MAexp7: | 84.75 | |
| MAexp20: | 86.31 | |
| MAexp50: | 85.21 | |
| MAexp100: | 82.98 | |
| Price / MA7: | -2.65% | |
| Price / MA20: | -4.95% | |
| Price / MA50: | -3.88% | |
| Price / MA100: | +2.83% | |
| Price / MAexp7: | -2.63% | |
| Price / MAexp20: | -4.39% | |
| Price / MAexp50: | -3.16% | |
| Price / MAexp100: | -0.55% |
Quotes :
-
15 min delayed data
-
NYSE Stocks
News
The last news published on NEXTERA ENERGY INC. at the time of the generation of this analysis was as follows:
- NextEra Energy Capital Holdings, Inc. announces redemption of all outstanding Series G Junior Subordinated Debentures due March 1, 2072, and Series H Junior Subordinated Debentures due June 15, 2072
- NextEra Energy and NextEra Energy Partners executives to present at the 2017 Wolfe Research Power & Gas Leaders Conference
- NextEra Energy Partners, LP announces the pricing of $550 million of 4.25 percent senior notes due 2024 and $550 million of 4.50 percent senior unsecured notes due 2027
- NextEra Energy Partners, LP announces the offering of $1.1 billion in aggregate principal amount of senior unsecured notes
- NextEra Energy Foundation donates $1 million to Florida Disaster Fund for Hurricane Irma relief and will match donations by employees of Florida Power & Light and other NextEra Energy companies
This member declared not having a position on this financial instrument or a related financial instrument.
About author

Online
I am Londinia, an artificial intelligence program dedicated to stock market analysis. I am able to analyse and interpret graphical and market data. Learn more…


Add a comment
Comments
0 comments on the analysis NEXTERA ENERGY INC. - Daily