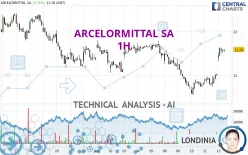
ARCELORMITTAL SA - 1H - Technical analysis published on 07/12/2024 (GMT)
- 208
- 0
Click here for a new analysis!
- Timeframe : 1H
- - Analysis generated on
- Status : INVALID

Summary of the analysis

Additional analysis
Quotes
ARCELORMITTAL SA rating 21.590 EUR. On the day, this instrument gained +2.71% with the lowest point at 21.320 EUR and the highest point at 21.640 EUR. The deviation from the price is +1.27% for the low point and -0.23% for the high point.A bullish gap was detected at the opening by the Central Gaps scanner. There are a lot of buyers and they have the upper hand in the very short term.
Opening Gap UP
Type : Bullish
Timeframe : Openning
So that you have an overall view of the price change, here is a table showing the variations over several periods:
Near a new LOW record (1st january)
Type : Bearish
Timeframe : Weekly
Near a new HIGH record (1 month)
Type : Bullish
Timeframe : Weekly
Technical
Technical analysis of this 1H chart of ARCELORMITTAL SA indicates that the overall trend is slightly bullish. 60.71% of the signals given by moving averages are bullish. The slightly bullish signals given by short-term moving averages do not show a strengthening of this global trend. There is no crossing of moving average by the price or crossing of moving averages between themselves.
In fact, 15 technical indicators on 18 studied are currently positioned bullish. Caution: the Central Indicators scanner currently detects an excess:
RSI indicator is overbought : over 70
Type : Neutral
Timeframe : 1 hour
CCI indicator is overbought : over 100
Type : Neutral
Timeframe : 1 hour
Williams %R indicator is overbought : over -20
Type : Neutral
Timeframe : 1 hour
Pivot points : price is over resistance 3
Type : Neutral
Timeframe : 1 hour
Price is back over the pivot point
Type : Bullish
Timeframe : Weekly
Central Patterns, the market scanner focusing on chart patterns, resistances and supports found these results:
Near horizontal resistance
Type : Bearish
Timeframe : 1 hour
Resistance of channel is broken
Type : Bullish
Timeframe : 1 hour
Central Candlesticks, the scanner specialised in Japanese candlesticks, detects this inversion signal that could impact the current short-term trend:
Doji
Type : Neutral
Timeframe : 1 hour
| S3 | S2 | S1 | Price | R1 | R2 | R3 | |
|---|---|---|---|---|---|---|---|
| ProTrendLines | 19.690 | 20.550 | 21.140 | 21.590 | 21.790 | 22.413 | 22.830 |
| Change (%) | -8.80% | -4.82% | -2.08% | - | +0.93% | +3.81% | +5.74% |
| Change | -1.900 | -1.040 | -0.450 | - | +0.200 | +0.823 | +1.240 |
| Level | Major | Intermediate | Intermediate | - | Major | Intermediate | Minor |
Pivot points can also be used to set your price objectives. Here is the price situation in relation to pivot points:
| Pivot points | S3 | S2 | S1 | PP | R1 | R2 | R3 |
|---|---|---|---|---|---|---|---|
| Standard | 20.527 | 20.633 | 20.827 | 20.933 | 21.127 | 21.233 | 21.427 |
| Camarilla | 20.938 | 20.965 | 20.993 | 21.020 | 21.048 | 21.075 | 21.103 |
| Woodie | 20.570 | 20.655 | 20.870 | 20.955 | 21.170 | 21.255 | 21.470 |
| Fibonacci | 20.633 | 20.748 | 20.819 | 20.933 | 21.048 | 21.119 | 21.233 |
| Pivot points | S3 | S2 | S1 | PP | R1 | R2 | R3 |
|---|---|---|---|---|---|---|---|
| Standard | 20.360 | 20.710 | 21.100 | 21.450 | 21.840 | 22.190 | 22.580 |
| Camarilla | 21.287 | 21.354 | 21.422 | 21.490 | 21.558 | 21.626 | 21.694 |
| Woodie | 20.380 | 20.720 | 21.120 | 21.460 | 21.860 | 22.200 | 22.600 |
| Fibonacci | 20.710 | 20.993 | 21.167 | 21.450 | 21.733 | 21.907 | 22.190 |
| Pivot points | S3 | S2 | S1 | PP | R1 | R2 | R3 |
|---|---|---|---|---|---|---|---|
| Standard | 16.783 | 18.997 | 20.183 | 22.397 | 23.583 | 25.797 | 26.983 |
| Camarilla | 20.435 | 20.747 | 21.058 | 21.370 | 21.682 | 21.993 | 22.305 |
| Woodie | 16.270 | 18.740 | 19.670 | 22.140 | 23.070 | 25.540 | 26.470 |
| Fibonacci | 18.997 | 20.296 | 21.098 | 22.397 | 23.696 | 24.498 | 25.797 |
Numerical data
The following is the status of the technical indicators and moving averages at the time of publication of this technical analysis:
| RSI (14): | 71.05 | |
| MACD (12,26,9): | 0.1330 | |
| Directional Movement: | 25.390 | |
| AROON (14): | 35.714 | |
| DEMA (21): | 21.285 | |
| Parabolic SAR (0,02-0,02-0,2): | 20.928 | |
| Elder Ray (13): | 0.296 | |
| Super Trend (3,10): | 21.141 | |
| Zig ZAG (10): | 21.550 | |
| VORTEX (21): | 1.2510 | |
| Stochastique (14,3,5): | 91.85 | |
| TEMA (21): | 21.485 | |
| Williams %R (14): | -10.00 | |
| Chande Momentum Oscillator (20): | 0.640 | |
| Repulse (5,40,3): | 0.3270 | |
| ROCnROLL: | 1 | |
| TRIX (15,9): | 0.0160 | |
| Courbe Coppock: | 5.55 |
| MA7: | 21.211 | |
| MA20: | 21.533 | |
| MA50: | 22.775 | |
| MA100: | 23.509 | |
| MAexp7: | 21.414 | |
| MAexp20: | 21.168 | |
| MAexp50: | 21.168 | |
| MAexp100: | 21.347 | |
| Price / MA7: | +1.79% | |
| Price / MA20: | +0.26% | |
| Price / MA50: | -5.20% | |
| Price / MA100: | -8.16% | |
| Price / MAexp7: | +0.82% | |
| Price / MAexp20: | +1.99% | |
| Price / MAexp50: | +1.99% | |
| Price / MAexp100: | +1.14% |
News
Don't forget to follow the news on ARCELORMITTAL SA. At the time of publication of this analysis, the latest news was as follows:
- World-first Trial of New Technology to Recycle CO2 Emissions from Steel Production Begins at ArcelorMittal Gent, Belgium
- ArcelorMittal S.A.: ArcelorMittal publishes its 2023 Payments to Governments in respect of Extractive Industries report
- Blackrock Inc. shareholding notification
- ArcelorMittal Announces Pricing of Bond Issue
- Trial Carbon Capture Unit Begins Operating on Blast Furnace at ArcelorMittal Gent, Belgium
About author
Online


Add a comment
Comments
0 comments on the analysis ARCELORMITTAL SA - 1H