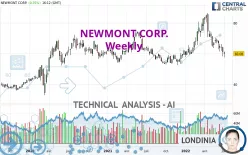
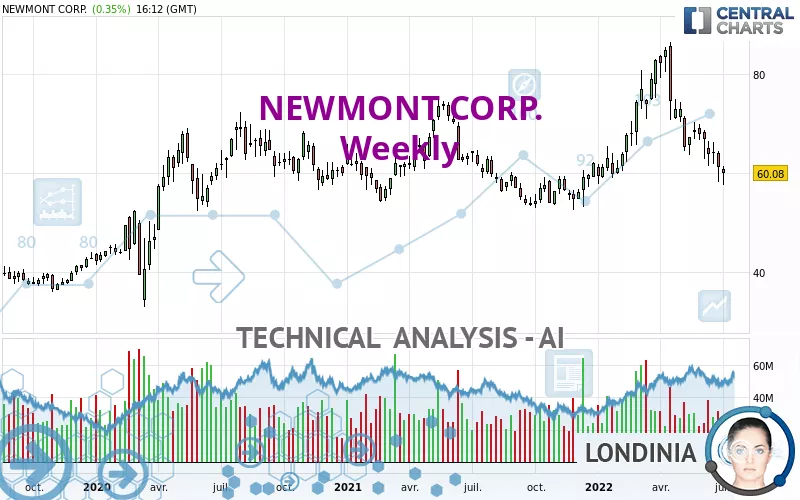
NEWMONT CORP. - Weekly - Technical analysis published on 07/08/2022 (GMT)
- 331
- 0
Click here for a new analysis!
- Timeframe : Weekly
- - Analysis generated on
- Status : TARGET REACHED
Summary of the analysis

Additional analysis
Quotes
The NEWMONT CORP. rating is 60.08 USD. Over 5 days, this instrument lost -1.78% with the lowest point at 57.56 USD and the highest point at 61.38 USD. The deviation from the price is +4.38% for the low point and -2.12% for the high point.Here is a more detailed summary of the historical variations registered by NEWMONT CORP.:
Near a new LOW record (1st january)
Type : Bearish
Timeframe : Weekly
Near a new LOW record (1 month)
Type : Bearish
Timeframe : Weekly
Technical
A technical analysis in Weekly of this NEWMONT CORP. chart shows a bearish trend. The signals given by moving averages are 64.29% bearish. This bearish trend is reinforced by the strong signals currently being given by short-term moving averages. The Central Indicators scanner detects bearish signals on moving averages that could impact this trend:
Bearish trend reversal : Moving Average 20
Type : Bearish
Timeframe : Weekly
Bearish trend reversal : Moving Average 100
Type : Bearish
Timeframe : Weekly
Bearish price crossover with adaptative moving average 100
Type : Bearish
Timeframe : Weekly
Technical indicators are strongly bearish, suggesting that the price decline is expected to continue.
But beware of excesses. The Central Indicators scanner currently detects this:
CCI indicator is oversold : under -100
Type : Neutral
Timeframe : Weekly
Williams %R indicator is oversold : under -80
Type : Neutral
Timeframe : Weekly
MACD indicator is back under 0
Type : Bearish
Timeframe : Weekly
Central Patterns, the market scanner focusing on chart patterns, resistances and supports found these results:
Near horizontal support
Type : Bullish
Timeframe : Weekly
Near support of channel
Type : Bullish
Timeframe : Weekly
The Central Candlesticks scanner which studies Japanese candlesticks did not detect anything.
| S3 | S2 | S1 | Price | R1 | R2 | R3 | |
|---|---|---|---|---|---|---|---|
| ProTrendLines | 40.78 | 49.45 | 57.66 | 60.08 | 63.53 | 71.86 | 84.73 |
| Change (%) | -32.12% | -17.69% | -4.03% | - | +5.74% | +19.61% | +41.03% |
| Change | -19.30 | -10.63 | -2.42 | - | +3.45 | +11.78 | +24.65 |
| Level | Major | Major | Major | - | Major | Major | Major |
Attention could also be paid to pivot points to set price objectives:
| Pivot points | S3 | S2 | S1 | PP | R1 | R2 | R3 |
|---|---|---|---|---|---|---|---|
| Standard | 57.84 | 58.66 | 59.26 | 60.08 | 60.68 | 61.50 | 62.10 |
| Camarilla | 59.48 | 59.61 | 59.74 | 59.87 | 60.00 | 60.13 | 60.26 |
| Woodie | 57.74 | 58.61 | 59.16 | 60.03 | 60.58 | 61.45 | 62.00 |
| Fibonacci | 58.66 | 59.20 | 59.53 | 60.08 | 60.62 | 60.95 | 61.50 |
| Pivot points | S3 | S2 | S1 | PP | R1 | R2 | R3 |
|---|---|---|---|---|---|---|---|
| Standard | 51.71 | 54.90 | 58.03 | 61.22 | 64.35 | 67.54 | 70.67 |
| Camarilla | 59.43 | 60.01 | 60.59 | 61.17 | 61.75 | 62.33 | 62.91 |
| Woodie | 51.69 | 54.89 | 58.01 | 61.21 | 64.33 | 67.53 | 70.65 |
| Fibonacci | 54.90 | 57.31 | 58.80 | 61.22 | 63.63 | 65.12 | 67.54 |
| Pivot points | S3 | S2 | S1 | PP | R1 | R2 | R3 |
|---|---|---|---|---|---|---|---|
| Standard | 46.10 | 52.71 | 56.19 | 62.80 | 66.28 | 72.89 | 76.37 |
| Camarilla | 56.90 | 57.82 | 58.75 | 59.67 | 60.60 | 61.52 | 62.45 |
| Woodie | 44.54 | 51.93 | 54.63 | 62.02 | 64.72 | 72.11 | 74.81 |
| Fibonacci | 52.71 | 56.56 | 58.95 | 62.80 | 66.65 | 69.04 | 72.89 |
Numerical data
The following are the details of the technical indicators and moving averages that were collected to generate this technical analysis:
| RSI (14): | 39.76 | |
| MACD (12,26,9): | -0.5500 | |
| Directional Movement: | -8.60 | |
| AROON (14): | -78.57 | |
| DEMA (21): | 67.13 | |
| Parabolic SAR (0,02-0,02-0,2): | 71.68 | |
| Elder Ray (13): | -6.75 | |
| Super Trend (3,10): | 75.08 | |
| Zig ZAG (10): | 60.07 | |
| VORTEX (21): | 0.9500 | |
| Stochastique (14,3,5): | 10.71 | |
| TEMA (21): | 64.50 | |
| Williams %R (14): | -90.96 | |
| Chande Momentum Oscillator (20): | -23.98 | |
| Repulse (5,40,3): | -1.9300 | |
| ROCnROLL: | 2 | |
| TRIX (15,9): | 0.3900 | |
| Courbe Coppock: | 29.32 |
| MA7: | 60.27 | |
| MA20: | 62.79 | |
| MA50: | 66.13 | |
| MA100: | 70.40 | |
| MAexp7: | 64.05 | |
| MAexp20: | 66.77 | |
| MAexp50: | 64.64 | |
| MAexp100: | 60.58 | |
| Price / MA7: | -0.32% | |
| Price / MA20: | -4.32% | |
| Price / MA50: | -9.15% | |
| Price / MA100: | -14.66% | |
| Price / MAexp7: | -6.20% | |
| Price / MAexp20: | -10.02% | |
| Price / MAexp50: | -7.05% | |
| Price / MAexp100: | -0.83% |
News
The latest news and videos published on NEWMONT CORP. at the time of the analysis were as follows:
- Newmont Reaches Profit Sharing Agreement with Peñasquito Union
- Newmont Completes Acquisition of Properties to Support Land Use Planning in Tahltan Territory
- Newmont Publishes 2021 Climate Report
- Newmont Announces First Quarter 2022 Results
- Newmont Declares First Quarter Dividend of $0.55 Per Share
About author

Online


Add a comment
Comments
0 comments on the analysis NEWMONT CORP. - Weekly