GMT - GMT/USDT overview
GMT - GMT/USDT
> Analyses
 Thank you
Reply
Chart
Thank you
Reply
Chart
Timeframe : 1H - Simple chart
Status : TARGET REACHED
All elements being clearly bullish, it would be possible for traders to trade only long positions (at the time of purchase) on STEPN - GMT/USDT as long as the price remains well above 0.068792 USDT.…
GMT - GMT/USDT
> Analyses
 Thank you
Reply
Chart
Thank you
Reply
Chart
Timeframe : 1H - Simple chart
Status : NEUTRAL
The basic trend is slightly bullish and the short term is tentatively bearish. With such a pattern, the price could just as easily move towards the first support as the first resistance. The first…
GMT - GMT/USDT
> Analyses
 Thank you
Reply
Chart
Thank you
Reply
Chart
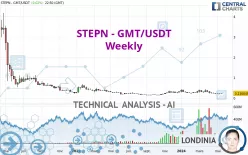
Timeframe : Weekly - Simple chart
Status : TARGET REACHED
All elements being clearly bearish, it would be possible for traders to trade only short positions (for sale) on STEPN - GMT/USDT as long as the price remains well below 0.300724 USDT. The sellers'…
GMT - GMT/USDT
> Analyses
 Thank you
Reply
Chart
Thank you
Reply
Chart
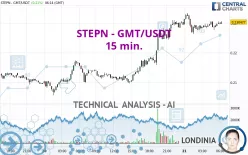
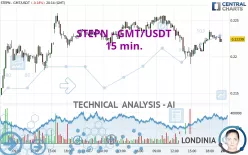
Timeframe : 15 min. - Simple chart
Status : LEVEL MAINTAINED
The basic bullish trend is very strong on STEPN - GMT/USDT but the short term shows some signs of running out of steam. However, a purchase could be considered as long as the price remains above…
GMT - GMT/USDT
> Analyses
 Thank you
Reply
Chart
Thank you
Reply
Chart
Timeframe : Weekly - Simple chart
Status : TARGET REACHED
All elements being clearly bearish, it would be possible for traders to trade only short positions (for sale) on STEPN - GMT/USDT as long as the price remains well below 0.328784 USDT. The sellers'…
GMT - GMT/USDT
> Analyses
 Thank you
Reply
Chart
Thank you
Reply
Chart
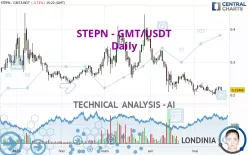
Timeframe : Daily - Simple chart
Status : INVALID
The bearish trend is currently very strong for STEPN - GMT/USDT. As long as the price remains below the resistance at 0.233280 USDT, you could try to take advantage of the bearish rally. The first…
GMT - GMT/USDT
> Analyses
 Thank you
Reply
Chart
Thank you
Reply
Chart
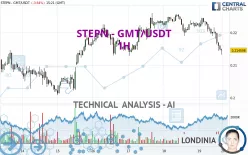
Timeframe : 1H - Simple chart
Status : TARGET REACHED
STEPN - GMT/USDT is part of a very strong bearish trend. Traders may consider trading only short positions (for sale) as long as the price remains well below 0.222421 USDT. The next support located at…
GMT - GMT/USDT
> Analyses
 Thank you
Reply
Chart
Thank you
Reply
Chart
Timeframe : 15 min. - Simple chart
Status : NEUTRAL
A slightly bullish trend and a neutral short term. With such a pattern, it is difficult to favour buying or selling. The first resistance is located at 0.228225 USDT. The first support is located at…

