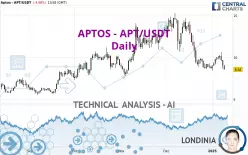
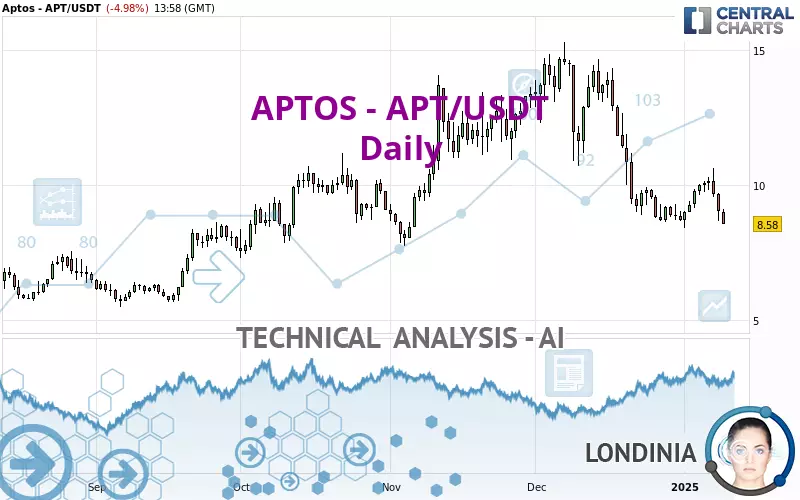
APTOS - APT/USDT - Daily - Technical analysis published on 01/09/2025 (GMT)
- 99
- 0
Click here for a new analysis!
- Timeframe : Daily
- - Analysis generated on
- Status : TARGET REACHED
Summary of the analysis

Additional analysis
Quotes
The APTOS - APT/USDT rating is 8.58 USDT. The price registered a decrease of -4.98% on the session with the lowest point at 8.58 USDT and the highest point at 9.12 USDT. The deviation from the price is 0% for the low point and -5.92% for the high point.The Central Gaps scanner detects a bearish opening. A small advantage for sellers in the very short term.
Bearish opening
Type : Bearish
Timeframe : Openning
Here is a more detailed summary of the historical variations registered by APTOS - APT/USDT:
Near a new LOW record (1st january)
Type : Bearish
Timeframe : Weekly
Near a new LOW record (1 month)
Type : Bearish
Timeframe : Weekly
Technical
Technical analysis of APTOS - APT/USDT in Daily shows an overall bearish trend. 75.00% of the signals given by moving averages are bearish. The overall trend is reinforced by the strong bearish signals from short-term moving averages. The Central Indicators market scanner currently does not detect any result that concerns moving averages.
Technical indicators are slightly bearish. There is therefore considerable uncertainty about the continuation of the decline.
Caution: the Central Indicators scanner currently detects an excess:
Williams %R indicator is oversold : under -80
Type : Neutral
Timeframe : Daily
Pivot points : price is under support 1
Type : Neutral
Timeframe : Weekly
Momentum indicator is back under 0
Type : Bearish
Timeframe : Daily
No signals are given by Central Patterns, a market scanner specialised in chart patterns, resistances and supports.
The Central Candlesticks scanner, specialised in Japanese candlesticks, did not identify any signals.
| S3 | S2 | S1 | Price | R1 | R2 | R3 | |
|---|---|---|---|---|---|---|---|
| ProTrendLines | 4.98 | 5.73 | 8.06 | 8.58 | 10.73 | 11.63 | 12.71 |
| Change (%) | -41.96% | -33.22% | -6.06% | - | +25.06% | +35.55% | +48.14% |
| Change | -3.60 | -2.85 | -0.52 | - | +2.15 | +3.05 | +4.13 |
| Level | Major | Intermediate | Major | - | Major | Minor | Minor |
To determine price objectives, it is also possible to use the pivot points. Here is the price position in relation to pivot points:
| Pivot points | S3 | S2 | S1 | PP | R1 | R2 | R3 |
|---|---|---|---|---|---|---|---|
| Standard | 7.57 | 8.13 | 8.58 | 9.14 | 9.59 | 10.15 | 10.60 |
| Camarilla | 8.75 | 8.85 | 8.94 | 9.03 | 9.12 | 9.22 | 9.31 |
| Woodie | 7.52 | 8.10 | 8.53 | 9.11 | 9.54 | 10.12 | 10.55 |
| Fibonacci | 8.13 | 8.52 | 8.75 | 9.14 | 9.53 | 9.76 | 10.15 |
| Pivot points | S3 | S2 | S1 | PP | R1 | R2 | R3 |
|---|---|---|---|---|---|---|---|
| Standard | 7.32 | 7.88 | 8.94 | 9.50 | 10.56 | 11.12 | 12.18 |
| Camarilla | 9.57 | 9.71 | 9.86 | 10.01 | 10.16 | 10.31 | 10.46 |
| Woodie | 7.58 | 8.01 | 9.20 | 9.63 | 10.82 | 11.25 | 12.44 |
| Fibonacci | 7.88 | 8.50 | 8.88 | 9.50 | 10.12 | 10.50 | 11.12 |
| Pivot points | S3 | S2 | S1 | PP | R1 | R2 | R3 |
|---|---|---|---|---|---|---|---|
| Standard | -0.20 | 4.22 | 6.47 | 10.89 | 13.14 | 17.56 | 19.81 |
| Camarilla | 6.89 | 7.50 | 8.11 | 8.72 | 9.33 | 9.94 | 10.55 |
| Woodie | -1.29 | 3.68 | 5.39 | 10.35 | 12.06 | 17.02 | 18.73 |
| Fibonacci | 4.22 | 6.77 | 8.34 | 10.89 | 13.44 | 15.01 | 17.56 |
Numerical data
The following is the status of technical indicators and moving averages registered at the time this technical analysis was created:
| RSI (14): | 36.09 | |
| MACD (12,26,9): | -0.6000 | |
| Directional Movement: | -8.43 | |
| AROON (14): | 42.85 | |
| DEMA (21): | 8.97 | |
| Parabolic SAR (0,02-0,02-0,2): | 10.63 | |
| Elder Ray (13): | -0.64 | |
| Super Trend (3,10): | 11.07 | |
| Zig ZAG (10): | 8.65 | |
| VORTEX (21): | 0.8200 | |
| Stochastique (14,3,5): | 31.36 | |
| TEMA (21): | 8.83 | |
| Williams %R (14): | -90.00 | |
| Chande Momentum Oscillator (20): | -0.54 | |
| Repulse (5,40,3): | -12.8700 | |
| ROCnROLL: | 2 | |
| TRIX (15,9): | -0.9900 | |
| Courbe Coppock: | 0.46 |
| MA7: | 9.63 | |
| MA20: | 9.34 | |
| MA50: | 11.56 | |
| MA100: | 10.74 | |
| MAexp7: | 9.33 | |
| MAexp20: | 9.82 | |
| MAexp50: | 10.58 | |
| MAexp100: | 10.35 | |
| Price / MA7: | -10.90% | |
| Price / MA20: | -8.14% | |
| Price / MA50: | -25.78% | |
| Price / MA100: | -20.11% | |
| Price / MAexp7: | -8.04% | |
| Price / MAexp20: | -12.63% | |
| Price / MAexp50: | -18.90% | |
| Price / MAexp100: | -17.10% |
About author

Online


Add a comment
Comments
0 comments on the analysis APTOS - APT/USDT - Daily