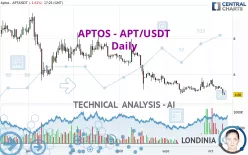
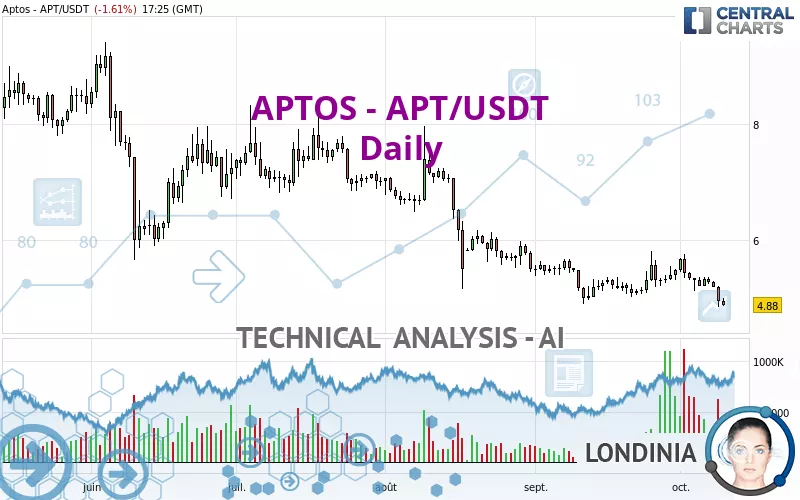
APTOS - APT/USDT - Daily - Technical analysis published on 10/10/2023 (GMT)
- 164
- 0
Click here for a new analysis!
- Timeframe : Daily
- - Analysis generated on
- Status : INVALID
Summary of the analysis

Additional analysis
Quotes
The APTOS - APT/USDT price is 4.88 USDT. The price registered a decrease of -1.61% on the session and was between 4.86 USDT and 5.00 USDT. This implies that the price is at +0.41% from its lowest and at -2.40% from its highest.A study of price movements over other periods shows the following variations:
Near a new LOW record (1 year)
Type : Bearish
Timeframe : Weekly
Near a new LOW record (1 month)
Type : Bearish
Timeframe : Weekly
The Central Volumes scanner detects abnormal volumes on the asset:
Abnormal volumes
Timeframe : 20 days
Technical
Technical analysis of this Daily chart of APTOS - APT/USDT indicates that the overall trend is strongly bearish. 92.86% of the signals given by moving averages are bearish. The overall trend is supported by the strong bearish signals from short-term moving averages. The Central Indicators market scanner is currently detecting a bearish signal that could impact this trend:
Bearish trend reversal : Moving Average 20
Type : Bearish
Timeframe : Daily
On the 18 technical indicators analysed, 4 are bullish, 4 are neutral and 10 are bearish. But beware of excesses. The Central Indicators scanner currently detects this:
CCI indicator is oversold : under -100
Type : Neutral
Timeframe : Daily
Williams %R indicator is oversold : under -80
Type : Neutral
Timeframe : Daily
Pivot points : price is under support 1
Type : Neutral
Timeframe : Weekly
No signals are given by Central Patterns, a market scanner specialised in chart patterns, resistances and supports.
The Central Candlesticks scanner which studies Japanese candlesticks did not detect anything.
| Price | R1 | R2 | R3 | |
|---|---|---|---|---|
| ProTrendLines | 4.88 | 5.04 | 6.96 | 9.18 |
| Change (%) | - | +3.28% | +42.62% | +88.11% |
| Change | - | +0.16 | +2.08 | +4.30 |
| Level | - | Major | Minor | Minor |
Attention could also be paid to pivot points to set price objectives:
| Pivot points | S3 | S2 | S1 | PP | R1 | R2 | R3 |
|---|---|---|---|---|---|---|---|
| Standard | 4.43 | 4.64 | 4.80 | 5.01 | 5.17 | 5.38 | 5.54 |
| Camarilla | 4.86 | 4.89 | 4.93 | 4.96 | 4.99 | 5.03 | 5.06 |
| Woodie | 4.41 | 4.63 | 4.78 | 5.00 | 5.15 | 5.37 | 5.52 |
| Fibonacci | 4.64 | 4.78 | 4.87 | 5.01 | 5.15 | 5.24 | 5.38 |
| Pivot points | S3 | S2 | S1 | PP | R1 | R2 | R3 |
|---|---|---|---|---|---|---|---|
| Standard | 4.37 | 4.75 | 5.01 | 5.39 | 5.65 | 6.03 | 6.29 |
| Camarilla | 5.10 | 5.16 | 5.22 | 5.28 | 5.34 | 5.40 | 5.46 |
| Woodie | 4.32 | 4.72 | 4.96 | 5.36 | 5.60 | 6.00 | 6.24 |
| Fibonacci | 4.75 | 4.99 | 5.14 | 5.39 | 5.63 | 5.78 | 6.03 |
| Pivot points | S3 | S2 | S1 | PP | R1 | R2 | R3 |
|---|---|---|---|---|---|---|---|
| Standard | 4.08 | 4.49 | 4.99 | 5.40 | 5.90 | 6.31 | 6.81 |
| Camarilla | 5.24 | 5.32 | 5.41 | 5.49 | 5.57 | 5.66 | 5.74 |
| Woodie | 4.13 | 4.51 | 5.04 | 5.42 | 5.95 | 6.33 | 6.86 |
| Fibonacci | 4.49 | 4.84 | 5.05 | 5.40 | 5.75 | 5.96 | 6.31 |
Numerical data
The following is the status of the technical indicators and moving averages at the time of publication of this technical analysis:
| RSI (14): | 34.54 | |
| MACD (12,26,9): | -0.1000 | |
| Directional Movement: | -9.97 | |
| AROON (14): | -50.00 | |
| DEMA (21): | 5.14 | |
| Parabolic SAR (0,02-0,02-0,2): | 5.71 | |
| Elder Ray (13): | -0.28 | |
| Super Trend (3,10): | 5.56 | |
| Zig ZAG (10): | 4.89 | |
| VORTEX (21): | 0.9500 | |
| Stochastique (14,3,5): | 9.31 | |
| TEMA (21): | 5.17 | |
| Williams %R (14): | -96.44 | |
| Chande Momentum Oscillator (20): | -0.45 | |
| Repulse (5,40,3): | -7.2300 | |
| ROCnROLL: | 2 | |
| TRIX (15,9): | -0.1400 | |
| Courbe Coppock: | 4.97 |
| MA7: | 5.17 | |
| MA20: | 5.29 | |
| MA50: | 5.40 | |
| MA100: | 6.21 | |
| MAexp7: | 5.13 | |
| MAexp20: | 5.26 | |
| MAexp50: | 5.54 | |
| MAexp100: | 6.25 | |
| Price / MA7: | -5.61% | |
| Price / MA20: | -7.75% | |
| Price / MA50: | -9.63% | |
| Price / MA100: | -21.42% | |
| Price / MAexp7: | -4.87% | |
| Price / MAexp20: | -7.22% | |
| Price / MAexp50: | -11.91% | |
| Price / MAexp100: | -21.92% |
About author

Online


Add a comment
Comments
0 comments on the analysis APTOS - APT/USDT - Daily