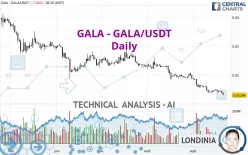
GALA - GALA/USDT - Daily - Technical analysis published on 09/21/2023 (GMT)
- 625
- 0
Click here for a new analysis!
- Timeframe : Daily
- - Analysis generated on
- Status : INVALID

Summary of the analysis

Additional analysis
Quotes
GALA - GALA/USDT rating 0.012940 USDT. On the day, this instrument lost -7.04% and was traded between 0.012940 USDT and 0.014110 USDT over the period. The price is currently at 0% from its lowest and -8.29% from its highest.A bearish opening was detected by the Central Gaps scanner. Sellers are trying to impose a bearish trend in the very short term.
Bearish opening
Type : Bearish
Timeframe : Openning
So that you have an overall view of the price change, here is a table showing the variations over several periods:
New LOW record (5 years)
Type : Bearish
Timeframe : Weekly
New LOW record (1 year)
Type : Bearish
Timeframe : Weekly
New LOW record (1st january)
Type : Bearish
Timeframe : Weekly
New LOW record (1 month)
Type : Bearish
Timeframe : Weekly
Technical
A technical analysis in Daily of this GALA - GALA/USDT chart shows a sharp bearish trend. The signals given by moving averages are 92.86% bearish. This strong bearish trend is confirmed by the strong signals currently being given by short-term moving averages. The Central Indicators scanner does not detect any result on moving averages that would impact this trend.
An assessment of technical indicators shows a bearish signal.
Caution: the Central Indicators scanner currently detects an excess:
RSI indicator is oversold : under 30
Type : Neutral
Timeframe : Daily
CCI indicator is oversold : under -100
Type : Neutral
Timeframe : Daily
Williams %R indicator is oversold : under -80
Type : Neutral
Timeframe : Daily
Pivot points : price is under support 3
Type : Neutral
Timeframe : Daily
Pivot points : price is under support 3
Type : Neutral
Timeframe : Weekly
The analysis of the price chart with Central Patterns scanners does not return any result.
The Central Candlesticks scanner which studies Japanese candlesticks did not detect anything.
| Price | R1 | R2 | R3 | |
|---|---|---|---|---|
| ProTrendLines | 0.012940 | 0.013930 | 0.021713 | 0.028390 |
| Change (%) | - | +7.65% | +67.80% | +119.40% |
| Change | - | +0.000990 | +0.008773 | +0.015450 |
| Level | - | Major | Intermediate | Minor |
Attention could also be paid to pivot points to set price objectives:
| Pivot points | S3 | S2 | S1 | PP | R1 | R2 | R3 |
|---|---|---|---|---|---|---|---|
| Standard | 0.012893 | 0.013287 | 0.013603 | 0.013997 | 0.014313 | 0.014707 | 0.015023 |
| Camarilla | 0.013725 | 0.013790 | 0.013855 | 0.013920 | 0.013985 | 0.014050 | 0.014115 |
| Woodie | 0.012855 | 0.013268 | 0.013565 | 0.013978 | 0.014275 | 0.014688 | 0.014985 |
| Fibonacci | 0.013287 | 0.013558 | 0.013725 | 0.013997 | 0.014268 | 0.014435 | 0.014707 |
| Pivot points | S3 | S2 | S1 | PP | R1 | R2 | R3 |
|---|---|---|---|---|---|---|---|
| Standard | 0.011343 | 0.012497 | 0.013673 | 0.014827 | 0.016003 | 0.017157 | 0.018333 |
| Camarilla | 0.014209 | 0.014423 | 0.014636 | 0.014850 | 0.015064 | 0.015277 | 0.015491 |
| Woodie | 0.011355 | 0.012503 | 0.013685 | 0.014833 | 0.016015 | 0.017163 | 0.018345 |
| Fibonacci | 0.012497 | 0.013387 | 0.013937 | 0.014827 | 0.015717 | 0.016267 | 0.017157 |
| Pivot points | S3 | S2 | S1 | PP | R1 | R2 | R3 |
|---|---|---|---|---|---|---|---|
| Standard | 0.008007 | 0.013073 | 0.015947 | 0.021013 | 0.023887 | 0.028953 | 0.031827 |
| Camarilla | 0.016637 | 0.017364 | 0.018092 | 0.018820 | 0.019548 | 0.020276 | 0.021004 |
| Woodie | 0.006910 | 0.012525 | 0.014850 | 0.020465 | 0.022790 | 0.028405 | 0.030730 |
| Fibonacci | 0.013073 | 0.016106 | 0.017980 | 0.021013 | 0.024046 | 0.025920 | 0.028953 |
Numerical data
The following are the details of the technical indicators and moving averages that were collected to generate this technical analysis:
| RSI (14): | 24.07 | |
| MACD (12,26,9): | -0.0014 | |
| Directional Movement: | -30.501250 | |
| AROON (14): | -92.857143 | |
| DEMA (21): | 0.013313 | |
| Parabolic SAR (0,02-0,02-0,2): | 0.014610 | |
| Elder Ray (13): | -0.001031 | |
| Super Trend (3,10): | 0.016082 | |
| Zig ZAG (10): | 0.013020 | |
| VORTEX (21): | 0.7013 | |
| Stochastique (14,3,5): | 11.79 | |
| TEMA (21): | 0.013224 | |
| Williams %R (14): | -98.79 | |
| Chande Momentum Oscillator (20): | -0.002970 | |
| Repulse (5,40,3): | -12.9146 | |
| ROCnROLL: | 2 | |
| TRIX (15,9): | -1.2352 | |
| Courbe Coppock: | 28.41 |
| MA7: | 0.014194 | |
| MA20: | 0.015103 | |
| MA50: | 0.018673 | |
| MA100: | 0.021644 | |
| MAexp7: | 0.014016 | |
| MAexp20: | 0.015308 | |
| MAexp50: | 0.018066 | |
| MAexp100: | 0.021624 | |
| Price / MA7: | -8.83% | |
| Price / MA20: | -14.32% | |
| Price / MA50: | -30.70% | |
| Price / MA100: | -40.21% | |
| Price / MAexp7: | -7.68% | |
| Price / MAexp20: | -15.47% | |
| Price / MAexp50: | -28.37% | |
| Price / MAexp100: | -40.16% |
About author

Online


Add a comment
Comments
0 comments on the analysis GALA - GALA/USDT - Daily