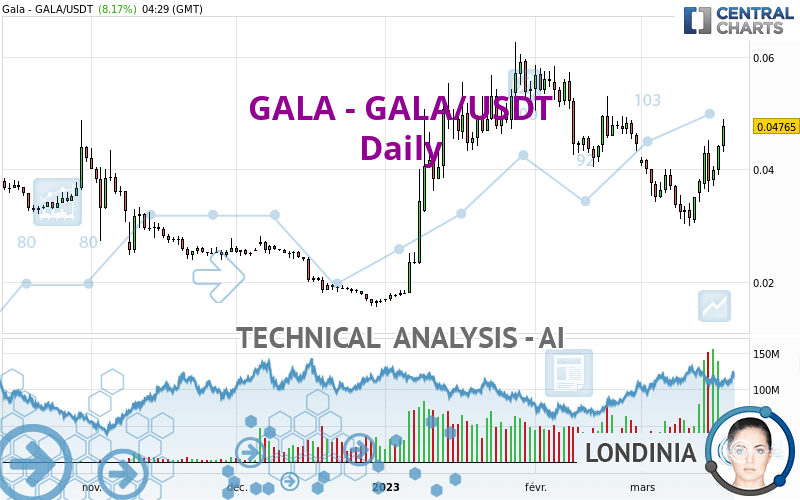
GALA - GALA/USDT - Daily - Technical analysis published on 03/18/2023 (GMT)
- 173
- 0
Click here for a new analysis!
- Timeframe : Daily
- - Analysis generated on
- Status : INVALID

Summary of the analysis

Additional analysis
Quotes
GALA - GALA/USDT rating 0.047650 USDT. On the day, this instrument gained +8.17% and was between 0.043120 USDT and 0.048930 USDT. This implies that the price is at +10.51% from its lowest and at -2.62% from its highest.The Central Gaps scanner detects a bearish opening. A small advantage for sellers in the very short term.
Bearish opening
Type : Bearish
Timeframe : Openning
A study of price movements over other periods shows the following variations:
Near a new HIGH record (1 month)
Type : Bullish
Timeframe : Weekly
The Central Volumes scanner detects abnormal volumes on the asset:
Abnormal volumes
Timeframe : 5 days
Abnormal volumes
Timeframe : 20 days
Abnormal volumes
Timeframe : 50 days
Technical
Technical analysis of GALA - GALA/USDT in Daily shows an overall bullish trend. The signals returned by the moving averages are 78.57% bullish. This bullish trend is reinforced by the strong signals currently being given by short-term moving averages. The Central Indicators market scanner is currently detecting several bullish signals that could impact this trend:
Bullish trend reversal : adaptative moving average 50
Type : Bullish
Timeframe : Daily
Bullish trend reversal : adaptative moving average 100
Type : Bullish
Timeframe : Daily
Bullish price crossover with Moving Average 50
Type : Bullish
Timeframe : Daily
Bullish price crossover with adaptative moving average 50
Type : Bullish
Timeframe : Daily
Technical indicators are strongly bullish, suggesting that the price increase should continue.
Caution: the Central Indicators scanner currently detects an excess:
CCI indicator is overbought : over 100
Type : Neutral
Timeframe : Daily
Williams %R indicator is overbought : over -20
Type : Neutral
Timeframe : Daily
Pivot points : price is over resistance 2
Type : Neutral
Timeframe : Daily
Pivot points : price is over resistance 3
Type : Neutral
Timeframe : Weekly
Central Patterns, the scanner specializing in chart patterns, did not identify any signals.
The presence of a bullish Japanese candlestick pattern detected by Central Candlesticks that could cause a very short term rebound was also detected:
Three white soldiers
Type : Bullish
Timeframe : Daily
| S3 | S2 | S1 | Price | R1 | R2 | |
|---|---|---|---|---|---|---|
| ProTrendLines | 0.038830 | 0.042110 | 0.047160 | 0.047650 | 0.052198 | 0.059110 |
| Change (%) | -18.51% | -11.63% | -1.03% | - | +9.54% | +24.05% |
| Change | -0.008820 | -0.005540 | -0.000490 | - | +0.004548 | +0.011460 |
| Level | Intermediate | Major | Minor | - | Minor | Intermediate |
Attention could also be paid to pivot points to set price objectives:
| Pivot points | S3 | S2 | S1 | PP | R1 | R2 | R3 |
|---|---|---|---|---|---|---|---|
| Standard | 0.035377 | 0.037183 | 0.040617 | 0.042423 | 0.045857 | 0.047663 | 0.051097 |
| Camarilla | 0.042609 | 0.043089 | 0.043570 | 0.044050 | 0.044530 | 0.045011 | 0.045491 |
| Woodie | 0.036190 | 0.037590 | 0.041430 | 0.042830 | 0.046670 | 0.048070 | 0.051910 |
| Fibonacci | 0.037183 | 0.039185 | 0.040422 | 0.042423 | 0.044425 | 0.045662 | 0.047663 |
| Pivot points | S3 | S2 | S1 | PP | R1 | R2 | R3 |
|---|---|---|---|---|---|---|---|
| Standard | 0.017547 | 0.023763 | 0.027527 | 0.033743 | 0.037507 | 0.043723 | 0.047487 |
| Camarilla | 0.028546 | 0.029460 | 0.030375 | 0.031290 | 0.032205 | 0.033120 | 0.034035 |
| Woodie | 0.016320 | 0.023150 | 0.026300 | 0.033130 | 0.036280 | 0.043110 | 0.046260 |
| Fibonacci | 0.023763 | 0.027576 | 0.029931 | 0.033743 | 0.037556 | 0.039911 | 0.043723 |
| Pivot points | S3 | S2 | S1 | PP | R1 | R2 | R3 |
|---|---|---|---|---|---|---|---|
| Standard | 0.018973 | 0.029697 | 0.037083 | 0.047807 | 0.055193 | 0.065917 | 0.073303 |
| Camarilla | 0.039490 | 0.041150 | 0.042810 | 0.044470 | 0.046130 | 0.047790 | 0.049450 |
| Woodie | 0.017305 | 0.028863 | 0.035415 | 0.046973 | 0.053525 | 0.065083 | 0.071635 |
| Fibonacci | 0.029697 | 0.036615 | 0.040889 | 0.047807 | 0.054725 | 0.058999 | 0.065917 |
Numerical data
The following is the status of technical indicators and moving averages registered at the time this technical analysis was created:
| RSI (14): | 59.86 | |
| MACD (12,26,9): | -0.0005 | |
| Directional Movement: | 17.860304 | |
| AROON (14): | 50.000000 | |
| DEMA (21): | 0.038983 | |
| Parabolic SAR (0,02-0,02-0,2): | 0.033147 | |
| Elder Ray (13): | 0.005797 | |
| Super Trend (3,10): | 0.031424 | |
| Zig ZAG (10): | 0.047940 | |
| VORTEX (21): | 0.9650 | |
| Stochastique (14,3,5): | 84.40 | |
| TEMA (21): | 0.039555 | |
| Williams %R (14): | -4.54 | |
| Chande Momentum Oscillator (20): | 0.009090 | |
| Repulse (5,40,3): | 22.7977 | |
| ROCnROLL: | 1 | |
| TRIX (15,9): | -0.8174 | |
| Courbe Coppock: | 7.59 |
| MA7: | 0.040814 | |
| MA20: | 0.038649 | |
| MA50: | 0.045687 | |
| MA100: | 0.036721 | |
| MAexp7: | 0.041650 | |
| MAexp20: | 0.040388 | |
| MAexp50: | 0.041318 | |
| MAexp100: | 0.042298 | |
| Price / MA7: | +16.75% | |
| Price / MA20: | +23.29% | |
| Price / MA50: | +4.30% | |
| Price / MA100: | +29.76% | |
| Price / MAexp7: | +14.41% | |
| Price / MAexp20: | +17.98% | |
| Price / MAexp50: | +15.33% | |
| Price / MAexp100: | +12.65% |
About author

Online


Add a comment
Comments
0 comments on the analysis GALA - GALA/USDT - Daily