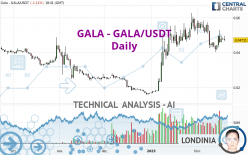
GALA - GALA/USDT - Daily - Technical analysis published on 02/19/2023 (GMT)
- 179
- 0
Click here for a new analysis!
- Timeframe : Daily
- - Analysis generated on
- Status : INVALID

Summary of the analysis

Additional analysis
Quotes
The GALA - GALA/USDT rating is 0.047110 USDT. On the day, this instrument lost -1.11% and was between 0.046370 USDT and 0.049370 USDT. This implies that the price is at +1.60% from its lowest and at -4.58% from its highest.The Central Gaps scanner detects a bearish opening marking the presence of sellers ahead of buyers at the opening but not sufficiently marked to allow the price to register a quotation gap.
Bullish opening
Type : Bullish
Timeframe : Openning
Bearish opening
Type : Bearish
Timeframe : Openning
A study of price movements over other periods shows the following variations:
Abnormal volumes
Timeframe : 5 days
Abnormal volumes
Timeframe : 20 days
Abnormal volumes
Timeframe : 50 days
Technical
Technical analysis of this Daily chart of GALA - GALA/USDT indicates that the overall trend is bullish. 67.86% of the signals given by moving averages are bullish. Caution: the neutral signals currently given by the short-term moving averages indicate that this bullish trend is showing signs of running out of steam. The Central Indicators market scanner is currently detecting several bearish and bullish signals that could impact this trend:
Bearish price crossover with adaptative moving average 50
Type : Bearish
Timeframe : Daily
Bullish price crossover with adaptative moving average 50
Type : Bullish
Timeframe : Daily
An assessment of technical indicators does not currently provide any relevant information to suggest whether the signal given by the technical indicators is more bullish or bearish.
Caution: the Central Indicators scanner currently detects an excess:
MACD indicator: bullish divergence
Type : Bullish
Timeframe : Daily
Pivot points : price is under support 1
Type : Neutral
Timeframe : Daily
RSI indicator is back over 50
Type : Bullish
Timeframe : Daily
RSI indicator is back under 50
Type : Bearish
Timeframe : Daily
Price is back under the pivot point
Type : Bearish
Timeframe : Weekly
No signals are given by Central Patterns, a market scanner specialised in chart patterns, resistances and supports.
For a small rebound in the very short term, the Central Candlesticks scanner currently notes the presence of this bullish pattern in Japanese candlesticks:
Bullish harami
Type : Bullish
Timeframe : Daily
| S3 | S2 | S1 | Price | R1 | R2 | R3 | |
|---|---|---|---|---|---|---|---|
| ProTrendLines | 0.025263 | 0.032865 | 0.044170 | 0.047110 | 0.052086 | 0.059110 | 0.070490 |
| Change (%) | -46.37% | -30.24% | -6.24% | - | +10.56% | +25.47% | +49.63% |
| Change | -0.021847 | -0.014245 | -0.002940 | - | +0.004976 | +0.012000 | +0.023380 |
| Level | Minor | Minor | Major | - | Major | Intermediate | Minor |
Pivot points can also be used to set your price objectives. Here is the price situation in relation to pivot points:
| Pivot points | S3 | S2 | S1 | PP | R1 | R2 | R3 |
|---|---|---|---|---|---|---|---|
| Standard | 0.045603 | 0.046407 | 0.047023 | 0.047827 | 0.048443 | 0.049247 | 0.049863 |
| Camarilla | 0.047250 | 0.047380 | 0.047510 | 0.047640 | 0.047770 | 0.047900 | 0.048031 |
| Woodie | 0.045510 | 0.046360 | 0.046930 | 0.047780 | 0.048350 | 0.049200 | 0.049770 |
| Fibonacci | 0.046407 | 0.046949 | 0.047284 | 0.047827 | 0.048369 | 0.048704 | 0.049247 |
| Pivot points | S3 | S2 | S1 | PP | R1 | R2 | R3 |
|---|---|---|---|---|---|---|---|
| Standard | 0.028473 | 0.034447 | 0.041043 | 0.047017 | 0.053613 | 0.059587 | 0.066183 |
| Camarilla | 0.044183 | 0.045336 | 0.046488 | 0.047640 | 0.048792 | 0.049945 | 0.051097 |
| Woodie | 0.028785 | 0.034603 | 0.041355 | 0.047173 | 0.053925 | 0.059743 | 0.066495 |
| Fibonacci | 0.034447 | 0.039248 | 0.042215 | 0.047017 | 0.051818 | 0.054785 | 0.059587 |
| Pivot points | S3 | S2 | S1 | PP | R1 | R2 | R3 |
|---|---|---|---|---|---|---|---|
| Standard | -0.020097 | -0.001873 | 0.026153 | 0.044377 | 0.072403 | 0.090627 | 0.118653 |
| Camarilla | 0.041461 | 0.045701 | 0.049940 | 0.054180 | 0.058420 | 0.062659 | 0.066899 |
| Woodie | -0.015195 | 0.000578 | 0.031055 | 0.046828 | 0.077305 | 0.093078 | 0.123555 |
| Fibonacci | -0.001873 | 0.015794 | 0.026709 | 0.044377 | 0.062044 | 0.072959 | 0.090627 |
Numerical data
The following is the status of the technical indicators and moving averages at the time of publication of this technical analysis:
| RSI (14): | 49.12 | |
| MACD (12,26,9): | -0.0001 | |
| Directional Movement: | 8.917756 | |
| AROON (14): | -57.142857 | |
| DEMA (21): | 0.048412 | |
| Parabolic SAR (0,02-0,02-0,2): | 0.053486 | |
| Elder Ray (13): | 0.000348 | |
| Super Trend (3,10): | 0.039177 | |
| Zig ZAG (10): | 0.046810 | |
| VORTEX (21): | 0.9119 | |
| Stochastique (14,3,5): | 40.52 | |
| TEMA (21): | 0.045371 | |
| Williams %R (14): | -61.14 | |
| Chande Momentum Oscillator (20): | -0.008570 | |
| Repulse (5,40,3): | -3.9101 | |
| ROCnROLL: | -1 | |
| TRIX (15,9): | 0.1726 | |
| Courbe Coppock: | 30.12 |
| MA7: | 0.046279 | |
| MA20: | 0.049604 | |
| MA50: | 0.044499 | |
| MA100: | 0.034088 | |
| MAexp7: | 0.046964 | |
| MAexp20: | 0.047846 | |
| MAexp50: | 0.044313 | |
| MAexp100: | 0.044796 | |
| Price / MA7: | +1.80% | |
| Price / MA20: | -5.03% | |
| Price / MA50: | +5.87% | |
| Price / MA100: | +38.20% | |
| Price / MAexp7: | +0.31% | |
| Price / MAexp20: | -1.54% | |
| Price / MAexp50: | +6.31% | |
| Price / MAexp100: | +5.17% |
About author

Online


Add a comment
Comments
0 comments on the analysis GALA - GALA/USDT - Daily