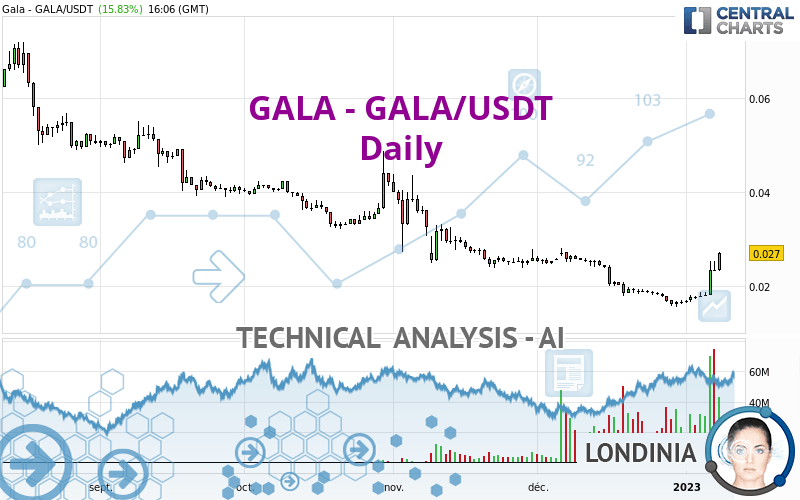
GALA - GALA/USDT - Daily - Technical analysis published on 01/08/2023 (GMT)
- 288
- 0
Click here for a new analysis!
- Timeframe : Daily
- - Analysis generated on
- Status : TARGET REACHED
Summary of the analysis

Additional analysis
Quotes
GALA - GALA/USDT rating 0.027020 USDT. On the day, this instrument gained +15.92% with the lowest point at 0.023120 USDT and the highest point at 0.027280 USDT. The deviation from the price is +16.87% for the low point and -0.95% for the high point.The Central Gaps scanner detects a bearish opening. A small advantage for sellers in the very short term.
Bullish opening
Type : Bullish
Timeframe : Openning
Bearish opening
Type : Bearish
Timeframe : Openning
A study of price movements over other periods shows the following variations:
New HIGH record (1st january)
Type : Bullish
Timeframe : Weekly
New HIGH record (1 month)
Type : Bullish
Timeframe : Weekly
Abnormal volumes on GALA - GALA/USDT were detected by the Central Volumes scanner:
Abnormal volumes
Timeframe : 5 days
Abnormal volumes
Timeframe : 20 days
Abnormal volumes
Timeframe : 50 days
Technical
Technical analysis of this Daily chart of GALA - GALA/USDT indicates that the overall trend is slightly bearish. Only 57.14% of the signals given by moving averages are bearish. This slightly bearish trend could quickly be reversed due to the strong bullish signals currently being given by short-term moving averages. The Central Indicators market scanner is currently detecting several bullish signals that could impact this trend:
Bullish price crossover with Moving Average 20
Type : Bullish
Timeframe : Daily
Bullish price crossover with Moving Average 50
Type : Bullish
Timeframe : Daily
Bullish price crossover with adaptative moving average 50
Type : Bullish
Timeframe : Daily
Bullish price crossover with adaptative moving average 100
Type : Bullish
Timeframe : Daily
In fact, according to the parameters integrated into the Central Analyzer system, 15 technical indicators out of 18 analysed are currently bullish. Caution: the Central Indicators scanner currently detects an excess:
RSI indicator is overbought : over 70
Type : Neutral
Timeframe : Daily
CCI indicator is overbought : over 100
Type : Neutral
Timeframe : Daily
Williams %R indicator is overbought : over -20
Type : Neutral
Timeframe : Daily
Pivot points : price is over resistance 3
Type : Neutral
Timeframe : Daily
Pivot points : price is over resistance 3
Type : Neutral
Timeframe : Weekly
Aroon indicator bullish trend
Type : Bullish
Timeframe : Daily
SuperTrend indicator bullish reversal
Type : Bullish
Timeframe : Daily
Ichimoku - Bullish crossover : Tenkan & Kijun
Type : Bullish
Timeframe : Daily
Momentum indicator is back over 0
Type : Bullish
Timeframe : Daily
No signals are given by Central Patterns, a market scanner specialised in chart patterns, resistances and supports.
For a small rebound in the very short term, the Central Candlesticks scanner currently notes the presence of these bullish patterns in Japanese candlesticks:
White marubozu
Type : Bullish
Timeframe : Daily
Long white line
Type : Bullish
Timeframe : Daily
| S1 | Price | R1 | R2 | R3 | |
|---|---|---|---|---|---|
| ProTrendLines | 0.016180 | 0.027020 | 0.027070 | 0.039440 | 0.052004 |
| Change (%) | -40.12% | - | +0.19% | +45.97% | +92.46% |
| Change | -0.010840 | - | +0.000050 | +0.012420 | +0.024984 |
| Level | Intermediate | - | Minor | Minor | Major |
To determine price objectives, it is also possible to use the pivot points. Here is the price position in relation to pivot points:
| Pivot points | S3 | S2 | S1 | PP | R1 | R2 | R3 |
|---|---|---|---|---|---|---|---|
| Standard | 0.020333 | 0.021717 | 0.022513 | 0.023897 | 0.024693 | 0.026077 | 0.026873 |
| Camarilla | 0.022711 | 0.022910 | 0.023110 | 0.023310 | 0.023510 | 0.023710 | 0.023910 |
| Woodie | 0.020040 | 0.021570 | 0.022220 | 0.023750 | 0.024400 | 0.025930 | 0.026580 |
| Fibonacci | 0.021717 | 0.022549 | 0.023064 | 0.023897 | 0.024729 | 0.025244 | 0.026077 |
| Pivot points | S3 | S2 | S1 | PP | R1 | R2 | R3 |
|---|---|---|---|---|---|---|---|
| Standard | 0.009083 | 0.012717 | 0.018013 | 0.021647 | 0.026943 | 0.030577 | 0.035873 |
| Camarilla | 0.020854 | 0.021673 | 0.022491 | 0.023310 | 0.024129 | 0.024947 | 0.025766 |
| Woodie | 0.009915 | 0.013133 | 0.018845 | 0.022063 | 0.027775 | 0.030993 | 0.036705 |
| Fibonacci | 0.012717 | 0.016128 | 0.018235 | 0.021647 | 0.025058 | 0.027165 | 0.030577 |
| Pivot points | S3 | S2 | S1 | PP | R1 | R2 | R3 |
|---|---|---|---|---|---|---|---|
| Standard | -0.000553 | 0.007473 | 0.012057 | 0.020083 | 0.024667 | 0.032693 | 0.037277 |
| Camarilla | 0.013172 | 0.014328 | 0.015484 | 0.016640 | 0.017796 | 0.018952 | 0.020108 |
| Woodie | -0.002275 | 0.006613 | 0.010335 | 0.019223 | 0.022945 | 0.031833 | 0.035555 |
| Fibonacci | 0.007473 | 0.012290 | 0.015266 | 0.020083 | 0.024900 | 0.027876 | 0.032693 |
Numerical data
The following is the status of technical indicators and moving averages registered at the time this technical analysis was created:
| RSI (14): | 73.05 | |
| MACD (12,26,9): | -0.0001 | |
| Directional Movement: | 23.815612 | |
| AROON (14): | 64.285714 | |
| DEMA (21): | 0.019532 | |
| Parabolic SAR (0,02-0,02-0,2): | 0.017105 | |
| Elder Ray (13): | 0.004781 | |
| Super Trend (3,10): | 0.019304 | |
| Zig ZAG (10): | 0.026490 | |
| VORTEX (21): | 1.0904 | |
| Stochastique (14,3,5): | 85.72 | |
| TEMA (21): | 0.021393 | |
| Williams %R (14): | -5.26 | |
| Chande Momentum Oscillator (20): | 0.008880 | |
| Repulse (5,40,3): | 24.2248 | |
| ROCnROLL: | 1 | |
| TRIX (15,9): | -0.9413 | |
| Courbe Coppock: | 27.77 |
| MA7: | 0.020687 | |
| MA20: | 0.018864 | |
| MA50: | 0.022334 | |
| MA100: | 0.030320 | |
| MAexp7: | 0.021801 | |
| MAexp20: | 0.020281 | |
| MAexp50: | 0.023552 | |
| MAexp100: | 0.040080 | |
| Price / MA7: | +30.61% | |
| Price / MA20: | +43.24% | |
| Price / MA50: | +20.98% | |
| Price / MA100: | -10.88% | |
| Price / MAexp7: | +23.94% | |
| Price / MAexp20: | +33.23% | |
| Price / MAexp50: | +14.72% | |
| Price / MAexp100: | -32.58% |
About author

Online


Add a comment
Comments
0 comments on the analysis GALA - GALA/USDT - Daily