CONFLUX - CFX/USDT - Daily - Technical analysis published on 03/20/2023 (GMT)
- 170
- 0
Click here for a new analysis!
- Timeframe : Daily
- - Analysis generated on
- Status : INVALID
Summary of the analysis

Additional analysis
Quotes
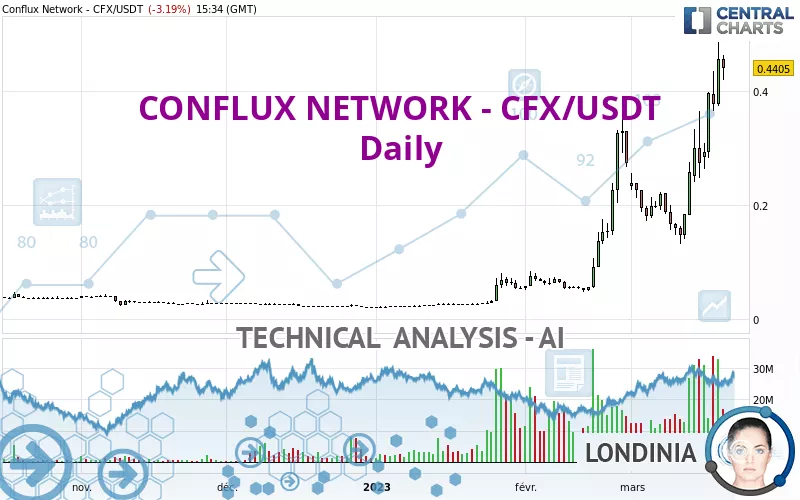
The CONFLUX NETWORK - CFX/USDT rating is 0.440500 USDT. On the day, this instrument lost -3.19% and was traded between 0.418500 USDT and 0.462700 USDT over the period. The price is currently at +5.26% from its lowest and -4.80% from its highest.The Central Gaps scanner detects a bullish opening. A small advantage for buyers in the very short term.
Bullish opening
Type : Bullish
Timeframe : Openning
Here is a more detailed summary of the historical variations registered by CONFLUX NETWORK - CFX/USDT:
New HIGH record (5 years)
Type : Bullish
Timeframe : Weekly
Near a new HIGH record (1 year)
Type : Bullish
Timeframe : Weekly
Near a new HIGH record (1st january)
Type : Bullish
Timeframe : Weekly
Near a new HIGH record (1 month)
Type : Bullish
Timeframe : Weekly
The Central Volumes scanner detects abnormal volumes on the asset:
Abnormal volumes
Timeframe : 5 days
Abnormal volumes
Timeframe : 20 days
Abnormal volumes
Timeframe : 50 days
Technical
Technical analysis of CONFLUX NETWORK - CFX/USDT in Daily shows a strongly overall bullish trend. The signals given by the moving averages are 92.86% bullish. This strong bullish trend is confirmed by the strong signals currently being given by short-term moving averages. The Central Indicators scanner does not detect any result on moving averages that would impact this trend.
The probability of a further increase is high given the direction of the technical indicators.
Caution: the Central Indicators scanner currently detects an excess:
RSI indicator is overbought : over 70
Type : Neutral
Timeframe : Daily
CCI indicator is overbought : over 100
Type : Neutral
Timeframe : Daily
Previous candle closed over Bollinger bands
Type : Neutral
Timeframe : Daily
RSI indicator: bearish divergence
Type : Bearish
Timeframe : Daily
Williams %R indicator is overbought : over -20
Type : Neutral
Timeframe : Daily
Central Patterns, the scanner specializing in chart patterns, did not identify any signals.
The Central Candlesticks scanner which studies Japanese candlesticks did not detect anything.
| S3 | S2 | S1 | Price | |
|---|---|---|---|---|
| ProTrendLines | 0.180500 | 0.219600 | 0.329100 | 0.440500 |
| Change (%) | -59.02% | -50.15% | -25.29% | - |
| Change | -0.260000 | -0.220900 | -0.111400 | - |
| Level | Minor | Intermediate | Intermediate | - |
To determine price objectives, it is also possible to use the pivot points. Here is the price position in relation to pivot points:
| Pivot points | S3 | S2 | S1 | PP | R1 | R2 | R3 |
|---|---|---|---|---|---|---|---|
| Standard | 0.277867 | 0.325533 | 0.390267 | 0.437933 | 0.502667 | 0.550333 | 0.615067 |
| Camarilla | 0.424090 | 0.434393 | 0.444697 | 0.455000 | 0.465303 | 0.475607 | 0.485910 |
| Woodie | 0.286400 | 0.329800 | 0.398800 | 0.442200 | 0.511200 | 0.554600 | 0.623600 |
| Fibonacci | 0.325533 | 0.368470 | 0.394997 | 0.437933 | 0.480870 | 0.507397 | 0.550333 |
| Pivot points | S3 | S2 | S1 | PP | R1 | R2 | R3 |
|---|---|---|---|---|---|---|---|
| Standard | -0.093300 | 0.023800 | 0.200100 | 0.317200 | 0.493500 | 0.610600 | 0.786900 |
| Camarilla | 0.295715 | 0.322610 | 0.349505 | 0.376400 | 0.403295 | 0.430190 | 0.457085 |
| Woodie | -0.063700 | 0.038600 | 0.229700 | 0.332000 | 0.523100 | 0.625400 | 0.816500 |
| Fibonacci | 0.023800 | 0.135879 | 0.205121 | 0.317200 | 0.429279 | 0.498521 | 0.610600 |
| Pivot points | S3 | S2 | S1 | PP | R1 | R2 | R3 |
|---|---|---|---|---|---|---|---|
| Standard | -0.224567 | -0.087953 | 0.092573 | 0.229187 | 0.409713 | 0.546327 | 0.726853 |
| Camarilla | 0.185887 | 0.214958 | 0.244029 | 0.273100 | 0.302171 | 0.331242 | 0.360314 |
| Woodie | -0.202610 | -0.076975 | 0.114530 | 0.240165 | 0.431670 | 0.557305 | 0.748810 |
| Fibonacci | -0.087953 | 0.033194 | 0.108039 | 0.229187 | 0.350334 | 0.425179 | 0.546327 |
Numerical data
The following is the status of the technical indicators and moving averages at the time of publication of this technical analysis:
| RSI (14): | 72.55 | |
| MACD (12,26,9): | 0.0689 | |
| Directional Movement: | 35.756847 | |
| AROON (14): | 57.142857 | |
| DEMA (21): | 0.361497 | |
| Parabolic SAR (0,02-0,02-0,2): | 0.245221 | |
| Elder Ray (13): | 0.123697 | |
| Super Trend (3,10): | 0.249834 | |
| Zig ZAG (10): | 0.438600 | |
| VORTEX (21): | 1.1137 | |
| Stochastique (14,3,5): | 86.28 | |
| TEMA (21): | 0.395396 | |
| Williams %R (14): | -13.24 | |
| Chande Momentum Oscillator (20): | 0.250000 | |
| Repulse (5,40,3): | 17.3347 | |
| ROCnROLL: | 1 | |
| TRIX (15,9): | 3.9311 | |
| Courbe Coppock: | 161.81 |
| MA7: | 0.361657 | |
| MA20: | 0.254935 | |
| MA50: | 0.161667 | |
| MA100: | 0.093275 | |
| MAexp7: | 0.368729 | |
| MAexp20: | 0.279340 | |
| MAexp50: | 0.191460 | |
| MAexp100: | 0.131115 | |
| Price / MA7: | +21.80% | |
| Price / MA20: | +72.79% | |
| Price / MA50: | +172.47% | |
| Price / MA100: | +372.26% | |
| Price / MAexp7: | +19.46% | |
| Price / MAexp20: | +57.69% | |
| Price / MAexp50: | +130.07% | |
| Price / MAexp100: | +235.96% |
About author

Online


Add a comment
Comments
0 comments on the analysis CONFLUX - CFX/USDT - Daily