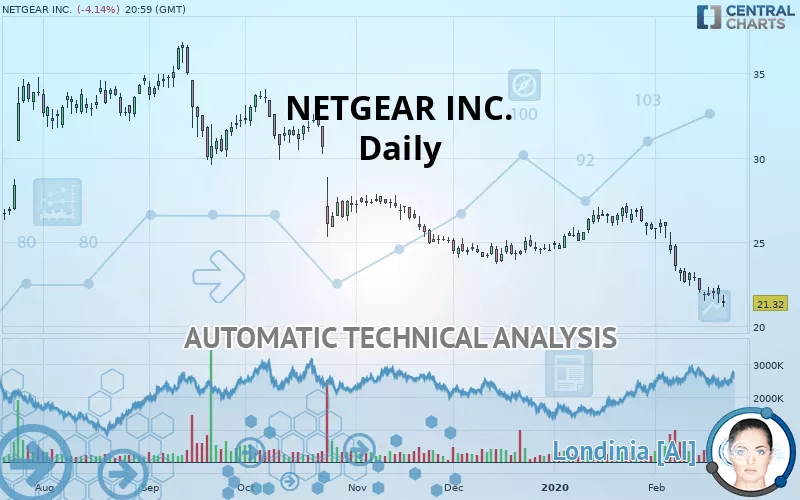
NETGEAR INC. - Daily - Technical analysis published on 02/24/2020 (GMT)
- 266
- 0
- Who voted?
Click here for a new analysis!
- Timeframe : Daily
- - Analysis generated on
- Status : TARGET REACHED

Summary of the analysis

Additional analysis
Quotes
The NETGEAR INC. price is 21.32 USD. On the day, this instrument lost -4.14% and was traded between 21.11 USD and 21.82 USD over the period. The price is currently at +0.99% from its lowest and -2.29% from its highest.The Central Gaps scanner detects a bearish opening. A small advantage for sellers in the very short term.
Bearish opening
Type : Bearish
Timeframe : Openning
Here is a more detailed summary of the historical variations registered by NETGEAR INC.:
New LOW record (5 years)
Type : Bearish
Timeframe : Weekly
New LOW record (1 year)
Type : Bearish
Timeframe : Weekly
New LOW record (1st january)
Type : Bearish
Timeframe : Weekly
New LOW record (1 month)
Type : Bearish
Timeframe : Weekly
Technical
A technical analysis in Daily of this NETGEAR INC. chart shows a sharp bearish trend. 92.86% of the signals given by moving averages are bearish. This strongly bearish trend is supported by the strong bearish signals given by short-term moving averages. The Central Indicators market scanner currently does not detect any result that concerns moving averages.
In fact, 11 technical indicators on 18 studied are currently positioned bearish. Caution: the Central Indicators scanner currently detects an excess:
RSI indicator is oversold : under 30
Type : Neutral
Timeframe : Daily
CCI indicator is oversold : under -100
Type : Neutral
Timeframe : Daily
Williams %R indicator is oversold : under -80
Type : Neutral
Timeframe : Daily
Pivot points : price is under support 1
Type : Neutral
Timeframe : Daily
Pivot points : price is under support 1
Type : Neutral
Timeframe : Weekly
Price is back over the pivot point
Type : Bullish
Timeframe : Daily
Price is back over the pivot point
Type : Bullish
Timeframe : Weekly
The analysis of the price chart with Central Patterns scanners does not return any result.
No result was found by the Central Candlesticks scanner on Japanese candlesticks.
| S2 | S1 | Price | R1 | R2 | R3 | |
|---|---|---|---|---|---|---|
| ProTrendLines | 8.72 | 17.21 | 21.32 | 25.09 | 30.01 | 34.21 |
| Change (%) | -59.10% | -19.28% | - | +17.68% | +40.76% | +60.46% |
| Change | -12.60 | -4.11 | - | +3.77 | +8.69 | +12.89 |
| Level | Minor | Minor | - | Major | Minor | Minor |
To determine price objectives, it is also possible to use the pivot points. Here is the price position in relation to pivot points:
| Pivot points | S3 | S2 | S1 | PP | R1 | R2 | R3 |
|---|---|---|---|---|---|---|---|
| Standard | 20.51 | 20.92 | 21.58 | 21.99 | 22.65 | 23.07 | 23.73 |
| Camarilla | 21.95 | 22.04 | 22.14 | 22.24 | 22.34 | 22.44 | 22.54 |
| Woodie | 20.63 | 20.98 | 21.70 | 22.05 | 22.78 | 23.13 | 23.85 |
| Fibonacci | 20.92 | 21.33 | 21.58 | 21.99 | 22.40 | 22.66 | 23.07 |
| Pivot points | S3 | S2 | S1 | PP | R1 | R2 | R3 |
|---|---|---|---|---|---|---|---|
| Standard | 21.69 | 23.11 | 24.42 | 25.84 | 27.15 | 28.57 | 29.88 |
| Camarilla | 24.97 | 25.22 | 25.47 | 25.72 | 25.97 | 26.22 | 26.47 |
| Woodie | 21.63 | 23.08 | 24.36 | 25.81 | 27.09 | 28.54 | 29.82 |
| Fibonacci | 23.11 | 24.16 | 24.80 | 25.84 | 26.89 | 27.53 | 28.57 |
Numerical data
The following is the status of the technical indicators and moving averages at the time of publication of this technical analysis:
| RSI (14): | 25.85 | |
| MACD (12,26,9): | -1.0800 | |
| Directional Movement: | -23.83 | |
| AROON (14): | -92.86 | |
| DEMA (21): | 22.20 | |
| Parabolic SAR (0,02-0,02-0,2): | 22.72 | |
| Elder Ray (13): | -1.39 | |
| Super Trend (3,10): | 24.02 | |
| Zig ZAG (10): | 21.32 | |
| VORTEX (21): | 0.6600 | |
| Stochastique (14,3,5): | 11.35 | |
| TEMA (21): | 21.44 | |
| Williams %R (14): | -95.97 | |
| Chande Momentum Oscillator (20): | -4.62 | |
| Repulse (5,40,3): | 0.4400 | |
| ROCnROLL: | 2 | |
| TRIX (15,9): | -0.4500 | |
| Courbe Coppock: | 30.38 |
| MA7: | 22.04 | |
| MA20: | 24.03 | |
| MA50: | 24.77 | |
| MA100: | 26.45 | |
| MAexp7: | 22.15 | |
| MAexp20: | 23.46 | |
| MAexp50: | 24.74 | |
| MAexp100: | 26.16 | |
| Price / MA7: | -3.27% | |
| Price / MA20: | -11.28% | |
| Price / MA50: | -13.93% | |
| Price / MA100: | -19.40% | |
| Price / MAexp7: | -3.75% | |
| Price / MAexp20: | -9.12% | |
| Price / MAexp50: | -13.82% | |
| Price / MAexp100: | -18.50% |
News
The last news published on NETGEAR INC. at the time of the generation of this analysis was as follows:
- NETGEAR Showcases Breakthrough AV-Over-IP Applications During Integrated Systems Europe
- NETGEAR® Reports Fourth Quarter and Full Year 2019 Results
- NETGEAR Schedules Fourth Quarter and Full Year 2019 Results Conference Call
- NETGEAR Appoints Laura Durr to the Board of Directors
- NETGEAR Hires Dr. Martin Westhead as Chief Technology Officer of Software
About author

Online


Add a comment
Comments
0 comments on the analysis NETGEAR INC. - Daily