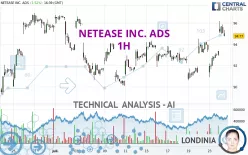
NETEASE INC. ADS - 1H - Technical analysis published on 07/24/2024 (GMT)
- 138
- 0
Click here for a new analysis!
- Timeframe : 1H
- - Analysis generated on
- Status : INVALID

Summary of the analysis

Additional analysis
Quotes
NETEASE INC. ADS rating 95.05 USD. The price registered an increase of +1.82% on the session and was between 94.85 USD and 96.18 USD. This implies that the price is at +0.21% from its lowest and at -1.17% from its highest.The Central Gaps scanner detects the formation of a bullish gap marking the strong presence of buyers against sellers at the opening. This formed a quotation gap.
Opening Gap UP
Type : Bullish
Timeframe : Openning
So that you have an overall view of the price change, here is a table showing the variations over several periods:
Near a new HIGH record (1 month)
Type : Bullish
Timeframe : Weekly
Technical
Technical analysis of this 1H chart of NETEASE INC. ADS indicates that the overall trend is strongly bullish. 92.86% of the signals given by moving averages are bullish. This strongly bullish trend is supported by the strong bullish signals given by short-term moving averages. There is no crossing of moving average by the price or crossing of moving averages between themselves.
The probability of a further increase is high given the direction of the technical indicators.
But beware of excesses. The Central Indicators scanner currently detects this:
CCI indicator is overbought : over 100
Type : Neutral
Timeframe : 1 hour
Williams %R indicator is overbought : over -20
Type : Neutral
Timeframe : 1 hour
Pivot points : price is over resistance 1
Type : Neutral
Timeframe : Weekly
Pivot points : price is over resistance 2
Type : Neutral
Timeframe : 1 hour
The Central Patterns scanner, which studies chart patterns, resistances and supports, has identified these signals:
Near horizontal resistance
Type : Bearish
Timeframe : 1 hour
Resistance of channel is broken
Type : Bullish
Timeframe : 1 hour
No result was found by the Central Candlesticks scanner on Japanese candlesticks.
| S3 | S2 | S1 | Price | R1 | R2 | R3 | |
|---|---|---|---|---|---|---|---|
| ProTrendLines | 91.88 | 92.97 | 94.50 | 95.05 | 95.74 | 96.93 | 102.27 |
| Change (%) | -3.34% | -2.19% | -0.58% | - | +0.73% | +1.98% | +7.60% |
| Change | -3.17 | -2.08 | -0.55 | - | +0.69 | +1.88 | +7.22 |
| Level | Minor | Major | Intermediate | - | Major | Intermediate | Major |
To determine price objectives, it is also possible to use the pivot points. Here is the price position in relation to pivot points:
| Pivot points | S3 | S2 | S1 | PP | R1 | R2 | R3 |
|---|---|---|---|---|---|---|---|
| Standard | 89.21 | 90.05 | 91.70 | 92.54 | 94.19 | 95.03 | 96.68 |
| Camarilla | 92.67 | 92.89 | 93.12 | 93.35 | 93.58 | 93.81 | 94.04 |
| Woodie | 89.62 | 90.25 | 92.11 | 92.74 | 94.60 | 95.23 | 97.09 |
| Fibonacci | 90.05 | 91.00 | 91.59 | 92.54 | 93.49 | 94.08 | 95.03 |
| Pivot points | S3 | S2 | S1 | PP | R1 | R2 | R3 |
|---|---|---|---|---|---|---|---|
| Standard | 86.12 | 88.36 | 89.86 | 92.10 | 93.60 | 95.84 | 97.34 |
| Camarilla | 90.32 | 90.66 | 91.01 | 91.35 | 91.69 | 92.04 | 92.38 |
| Woodie | 85.74 | 88.18 | 89.48 | 91.92 | 93.22 | 95.66 | 96.96 |
| Fibonacci | 88.36 | 89.79 | 90.68 | 92.10 | 93.53 | 94.42 | 95.84 |
| Pivot points | S3 | S2 | S1 | PP | R1 | R2 | R3 |
|---|---|---|---|---|---|---|---|
| Standard | 79.65 | 83.37 | 89.48 | 93.20 | 99.31 | 103.03 | 109.14 |
| Camarilla | 92.88 | 93.78 | 94.68 | 95.58 | 96.48 | 97.38 | 98.28 |
| Woodie | 80.84 | 83.97 | 90.67 | 93.80 | 100.50 | 103.63 | 110.33 |
| Fibonacci | 83.37 | 87.13 | 89.45 | 93.20 | 96.96 | 99.28 | 103.03 |
Numerical data
The following is the status of the technical indicators and moving averages at the time of publication of this technical analysis:
| RSI (14): | 64.03 | |
| MACD (12,26,9): | 0.6100 | |
| Directional Movement: | 18.92 | |
| AROON (14): | 50.00 | |
| DEMA (21): | 94.31 | |
| Parabolic SAR (0,02-0,02-0,2): | 91.20 | |
| Elder Ray (13): | 1.10 | |
| Super Trend (3,10): | 92.93 | |
| Zig ZAG (10): | 95.18 | |
| VORTEX (21): | 1.0700 | |
| Stochastique (14,3,5): | 83.43 | |
| TEMA (21): | 94.82 | |
| Williams %R (14): | -19.38 | |
| Chande Momentum Oscillator (20): | 1.18 | |
| Repulse (5,40,3): | -0.0800 | |
| ROCnROLL: | 1 | |
| TRIX (15,9): | 0.0500 | |
| Courbe Coppock: | 2.71 |
| MA7: | 93.11 | |
| MA20: | 93.62 | |
| MA50: | 93.79 | |
| MA100: | 96.63 | |
| MAexp7: | 94.52 | |
| MAexp20: | 93.65 | |
| MAexp50: | 93.15 | |
| MAexp100: | 93.02 | |
| Price / MA7: | +2.08% | |
| Price / MA20: | +1.53% | |
| Price / MA50: | +1.34% | |
| Price / MA100: | -1.64% | |
| Price / MAexp7: | +0.56% | |
| Price / MAexp20: | +1.49% | |
| Price / MAexp50: | +2.04% | |
| Price / MAexp100: | +2.18% |
News
The last news published on NETEASE INC. ADS at the time of the generation of this analysis was as follows:
- NetEase Cloud Music Partners with Timbaland's Beatclub™ to Revolutionise China's Beat Marketplace
- NetEase Announces First Quarter 2024 Unaudited Financial Results
- NetEase Showcases Latest Game Advancements at 2024 Annual Product Launch Event
- Cloud Music Inc. Expands K-Pop Portfolio with Kakao Entertainment
- Cloud Music Inc. Expands K-Pop Portfolio with Kakao Entertainment
About author
Online


Add a comment
Comments
0 comments on the analysis NETEASE INC. ADS - 1H