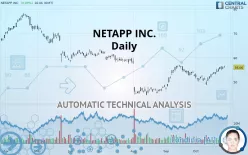
NETAPP INC. - Daily - Technical analysis published on 10/28/2019 (GMT)
- 337
- 0
- Who voted?
Click here for a new analysis!
- Timeframe : Daily
- - Analysis generated on
- Status : TARGET REACHED

Summary of the analysis

Additional analysis
Quotes
NETAPP INC. rating 56.06 USD. The price registered an increase of +0.09% on the session and was between 55.94 USD and 56.63 USD. This implies that the price is at +0.21% from its lowest and at -1.01% from its highest.A bullish opening was detected by the Central Gaps scanner. Buyers are trying to impose a bullish momentum in the very short term.
Bullish opening
Type : Bullish
Timeframe : Openning
So that you have an overall view of the price change, here is a table showing the variations over several periods:
Technical
Technical analysis of this Daily chart of NETAPP INC. indicates that the overall trend is bullish. The signals returned by the moving averages are 67.86% bullish. This bullish trend is reinforced by the strong signals currently being given by short-term moving averages. The Central Indicators market scanner currently does not detect any result that concerns moving averages.
Technical indicators are strongly bullish, suggesting that the price increase should continue.
Caution: the Central Indicators scanner currently detects an excess:
CCI indicator is overbought : over 100
Type : Neutral
Timeframe : Daily
Williams %R indicator is overbought : over -20
Type : Neutral
Timeframe : Daily
Price is back over the pivot point
Type : Bullish
Timeframe : Daily
Price is back over the pivot point
Type : Bullish
Timeframe : Weekly
The Central Patterns scanner, which studies chart patterns, resistances and supports, has identified these signals:
Near resistance of channel
Type : Bearish
Timeframe : Daily
Near horizontal support
Type : Bullish
Timeframe : Daily
The presence of a bullish Japanese candlestick pattern detected by Central Candlesticks that could cause a very short term rebound was also detected:
Bullish harami
Type : Bullish
Timeframe : Daily
| S3 | S2 | S1 | Price | R1 | R2 | R3 | |
|---|---|---|---|---|---|---|---|
| ProTrendLines | 44.80 | 49.78 | 54.88 | 56.06 | 60.60 | 63.35 | 69.83 |
| Change (%) | -20.09% | -11.20% | -2.10% | - | +8.10% | +13.00% | +24.56% |
| Change | -11.26 | -6.28 | -1.18 | - | +4.54 | +7.29 | +13.77 |
| Level | Intermediate | Intermediate | Intermediate | - | Major | Intermediate | Minor |
Attention could also be paid to pivot points to set price objectives:
| Pivot points | S3 | S2 | S1 | PP | R1 | R2 | R3 |
|---|---|---|---|---|---|---|---|
| Standard | 54.27 | 54.78 | 55.39 | 55.90 | 56.51 | 57.02 | 57.63 |
| Camarilla | 55.70 | 55.81 | 55.91 | 56.01 | 56.11 | 56.22 | 56.32 |
| Woodie | 54.33 | 54.81 | 55.45 | 55.93 | 56.57 | 57.05 | 57.69 |
| Fibonacci | 54.78 | 55.21 | 55.47 | 55.90 | 56.33 | 56.59 | 57.02 |
| Pivot points | S3 | S2 | S1 | PP | R1 | R2 | R3 |
|---|---|---|---|---|---|---|---|
| Standard | 51.88 | 52.89 | 54.45 | 55.46 | 57.02 | 58.03 | 59.59 |
| Camarilla | 55.30 | 55.54 | 55.77 | 56.01 | 56.25 | 56.48 | 56.72 |
| Woodie | 52.16 | 53.03 | 54.73 | 55.60 | 57.30 | 58.17 | 59.87 |
| Fibonacci | 52.89 | 53.87 | 54.48 | 55.46 | 56.44 | 57.05 | 58.03 |
| Pivot points | S3 | S2 | S1 | PP | R1 | R2 | R3 |
|---|---|---|---|---|---|---|---|
| Standard | 36.48 | 41.37 | 46.70 | 51.59 | 56.91 | 61.80 | 67.12 |
| Camarilla | 49.21 | 50.15 | 51.08 | 52.02 | 52.96 | 53.89 | 54.83 |
| Woodie | 36.70 | 41.48 | 46.91 | 51.70 | 57.13 | 61.91 | 67.34 |
| Fibonacci | 41.37 | 45.28 | 47.69 | 51.59 | 55.49 | 57.90 | 61.80 |
Numerical data
The following are the details of the technical indicators and moving averages that were collected to generate this technical analysis:
| RSI (14): | 63.75 | |
| MACD (12,26,9): | 1.0100 | |
| Directional Movement: | 13.19 | |
| AROON (14): | 85.71 | |
| DEMA (21): | 55.00 | |
| Parabolic SAR (0,02-0,02-0,2): | 52.66 | |
| Elder Ray (13): | 1.87 | |
| Super Trend (3,10): | 52.41 | |
| Zig ZAG (10): | 56.08 | |
| VORTEX (21): | 1.0500 | |
| Stochastique (14,3,5): | 91.15 | |
| TEMA (21): | 55.73 | |
| Williams %R (14): | -7.32 | |
| Chande Momentum Oscillator (20): | 6.29 | |
| Repulse (5,40,3): | 0.2200 | |
| ROCnROLL: | 1 | |
| TRIX (15,9): | 0.1700 | |
| Courbe Coppock: | 15.09 |
| MA7: | 55.25 | |
| MA20: | 53.02 | |
| MA50: | 51.82 | |
| MA100: | 54.27 | |
| MAexp7: | 55.23 | |
| MAexp20: | 53.85 | |
| MAexp50: | 53.24 | |
| MAexp100: | 54.98 | |
| Price / MA7: | +1.47% | |
| Price / MA20: | +5.73% | |
| Price / MA50: | +8.18% | |
| Price / MA100: | +3.30% | |
| Price / MAexp7: | +1.50% | |
| Price / MAexp20: | +4.10% | |
| Price / MAexp50: | +5.30% | |
| Price / MAexp100: | +1.96% |
News
Don"t forget to follow the news on NETAPP INC.. At the time of publication of this analysis, the latest news was as follows:
- Rubrik Delivers Next-Generation Data Management with NetApp Across Hybrid Multi-cloud
- NetApp Hosts Technology Sessions at 2019 INSIGHT Conference in Las Vegas, Nevada
- INVESTOR REMINDER: Kessler Topaz Meltzer & Check, LLP Announces Deadline in Securities Fraud Class Action Lawsuit Filed Against NetApp, Inc.
- Rubrik and NetApp Bring Policy-Based Data Management to Cloud-Scale Architectures
- Lifshitz & Miller LLP Announces Investigation of 2U, Inc., Buford Capital Limited, Evolent Health, Inc., Greenlane Holdings, Inc., International Flavors and Fragrances, Inc., NetApp, Inc., and Valaris PLC
About author

Online


Add a comment
Comments
0 comments on the analysis NETAPP INC. - Daily