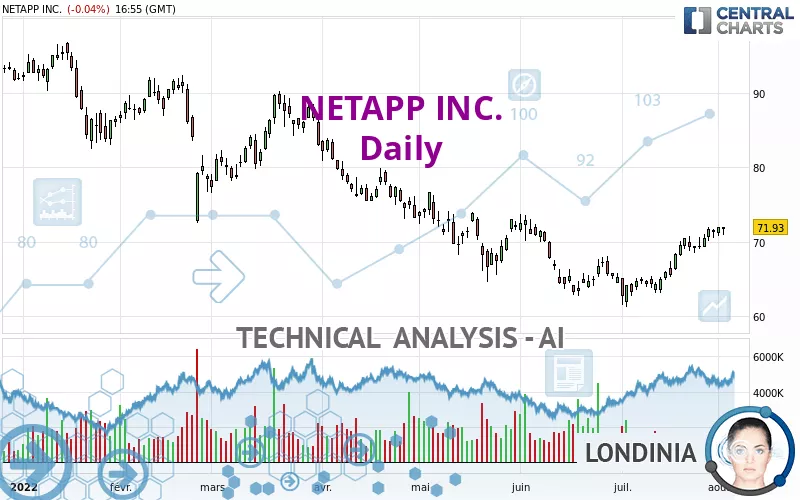
NETAPP INC. - Daily - Technical analysis published on 08/02/2022 (GMT)
- 255
- 0
Click here for a new analysis!
- Timeframe : Daily
- - Analysis generated on
- Status : TARGET REACHED
Summary of the analysis

Additional analysis
Quotes
NETAPP INC. rating 71.93 USD. On the day, this instrument lost -0.04% with the lowest point at 70.92 USD and the highest point at 71.94 USD. The deviation from the price is +1.42% for the low point and -0.01% for the high point.A bearish opening was detected by the Central Gaps scanner. Sellers are trying to impose a bearish trend in the very short term.
Bearish opening
Type : Bearish
Timeframe : Openning
A study of price movements over other periods shows the following variations:
Near a new HIGH record (1 month)
Type : Bullish
Timeframe : Weekly
Technical
Technical analysis of NETAPP INC. in Daily shows a neutral overall trend. The trend could quickly turn bullish due to the strong bullish signals currently being given by short-term moving averages. The Central Indicators scanner detects a bullish signal on moving averages that could impact this trend:
Moving Average bullish crossovers : AMA20 & AMA50
Type : Bullish
Timeframe : Daily
In fact, according to the parameters integrated into the Central Analyzer system, 14 technical indicators out of 18 analysed are currently bullish. Caution: the Central Indicators scanner currently detects an excess:
Williams %R indicator is overbought : over -20
Type : Neutral
Timeframe : Daily
The Central Patterns scanner, which studies chart patterns, resistances and supports, has identified these signals:
Near resistance of channel
Type : Bearish
Timeframe : Daily
Near horizontal support
Type : Bullish
Timeframe : Daily
The Central Candlesticks scanner which studies Japanese candlesticks did not detect anything.
| S3 | S2 | S1 | Price | R1 | R2 | R3 | |
|---|---|---|---|---|---|---|---|
| ProTrendLines | 60.41 | 66.74 | 70.02 | 71.93 | 77.89 | 84.35 | 88.42 |
| Change (%) | -16.02% | -7.22% | -2.66% | - | +8.29% | +17.27% | +22.93% |
| Change | -11.52 | -5.19 | -1.91 | - | +5.96 | +12.42 | +16.49 |
| Level | Major | Major | Major | - | Major | Minor | Intermediate |
Attention could also be paid to pivot points to set price objectives:
| Pivot points | S3 | S2 | S1 | PP | R1 | R2 | R3 |
|---|---|---|---|---|---|---|---|
| Standard | 69.88 | 70.33 | 71.15 | 71.60 | 72.42 | 72.87 | 73.69 |
| Camarilla | 71.61 | 71.73 | 71.84 | 71.96 | 72.08 | 72.19 | 72.31 |
| Woodie | 70.06 | 70.42 | 71.33 | 71.69 | 72.60 | 72.96 | 73.87 |
| Fibonacci | 70.33 | 70.82 | 71.12 | 71.60 | 72.09 | 72.39 | 72.87 |
| Pivot points | S3 | S2 | S1 | PP | R1 | R2 | R3 |
|---|---|---|---|---|---|---|---|
| Standard | 65.85 | 67.19 | 69.26 | 70.60 | 72.67 | 74.01 | 76.08 |
| Camarilla | 70.39 | 70.71 | 71.02 | 71.33 | 71.64 | 71.96 | 72.27 |
| Woodie | 66.22 | 67.37 | 69.63 | 70.78 | 73.04 | 74.19 | 76.45 |
| Fibonacci | 67.19 | 68.49 | 69.30 | 70.60 | 71.90 | 72.71 | 74.01 |
| Pivot points | S3 | S2 | S1 | PP | R1 | R2 | R3 |
|---|---|---|---|---|---|---|---|
| Standard | 52.93 | 56.86 | 64.09 | 68.02 | 75.25 | 79.18 | 86.41 |
| Camarilla | 68.26 | 69.28 | 70.31 | 71.33 | 72.35 | 73.38 | 74.40 |
| Woodie | 54.59 | 57.69 | 65.75 | 68.85 | 76.91 | 80.01 | 88.07 |
| Fibonacci | 56.86 | 61.12 | 63.75 | 68.02 | 72.28 | 74.91 | 79.18 |
Numerical data
The following is the status of technical indicators and moving averages registered at the time this technical analysis was created:
| RSI (14): | 65.80 | |
| MACD (12,26,9): | 1.4700 | |
| Directional Movement: | 14.48 | |
| AROON (14): | 92.86 | |
| DEMA (21): | 70.39 | |
| Parabolic SAR (0,02-0,02-0,2): | 68.70 | |
| Elder Ray (13): | 1.67 | |
| Super Trend (3,10): | 66.51 | |
| Zig ZAG (10): | 71.86 | |
| VORTEX (21): | 1.2300 | |
| Stochastique (14,3,5): | 96.57 | |
| TEMA (21): | 72.27 | |
| Williams %R (14): | -2.58 | |
| Chande Momentum Oscillator (20): | 5.90 | |
| Repulse (5,40,3): | 3.1900 | |
| ROCnROLL: | 1 | |
| TRIX (15,9): | 0.2000 | |
| Courbe Coppock: | 19.92 |
| MA7: | 70.86 | |
| MA20: | 67.80 | |
| MA50: | 67.27 | |
| MA100: | 72.53 | |
| MAexp7: | 70.92 | |
| MAexp20: | 68.84 | |
| MAexp50: | 68.81 | |
| MAexp100: | 71.96 | |
| Price / MA7: | +1.51% | |
| Price / MA20: | +6.09% | |
| Price / MA50: | +6.93% | |
| Price / MA100: | -0.83% | |
| Price / MAexp7: | +1.42% | |
| Price / MAexp20: | +4.49% | |
| Price / MAexp50: | +4.53% | |
| Price / MAexp100: | -0.04% |
News
The latest news and videos published on NETAPP INC. at the time of the analysis were as follows:
- Spot by NetApp Announces Continuous Security Solution for Cloud Infrastructure
- NetApp Powers Porsche Motorsport to ABB FIA Formula E World Championship Wins with Data-driven Cloud Solutions
- NetApp Simplifies Hybrid Cloud Operations, Protects Against Ransomware Threats and Helps Accelerate VMware Workload Transitions to the Cloud
- NetApp to Participate in Upcoming Technology Conference
- NetApp Reports Fourth Quarter and Fiscal Year 2022 Results
About author
Online


Add a comment
Comments
0 comments on the analysis NETAPP INC. - Daily