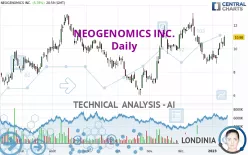
NEOGENOMICS INC. - Daily - Technical analysis published on 01/15/2023 (GMT)
- 207
- 0
Click here for a new analysis!
- Timeframe : Daily
- - Analysis generated on
- Status : TARGET REACHED

Summary of the analysis

Additional analysis
Quotes
The NEOGENOMICS INC. rating is 10.98 USD. The price has increased by +5.78% since the last closing and was between 10.24 USD and 11.14 USD. This implies that the price is at +7.23% from its lowest and at -1.44% from its highest.A bearish opening was detected by the Central Gaps scanner. Sellers are trying to impose a bearish trend in the very short term.
Bearish opening
Type : Bearish
Timeframe : Openning
Here is a more detailed summary of the historical variations registered by NEOGENOMICS INC.:
New HIGH record (1st january)
Type : Bullish
Timeframe : Weekly
Technical
Technical analysis of this Daily chart of NEOGENOMICS INC. indicates that the overall trend is strongly bullish. 82.14% of the signals given by moving averages are bullish. The slightly bullish signals given by the short-term moving averages show a weakening of the global trend. The Central Indicators market scanner currently does not detect any result that concerns moving averages.
In fact, 13 technical indicators on 18 studied are currently positioned bullish. But beware of excesses. The Central Indicators scanner currently detects this:
CCI indicator is overbought : over 100
Type : Neutral
Timeframe : Daily
Williams %R indicator is overbought : over -20
Type : Neutral
Timeframe : Daily
Pivot points : price is over resistance 2
Type : Neutral
Timeframe : Daily
Pivot points : price is over resistance 3
Type : Neutral
Timeframe : Weekly
SuperTrend indicator bullish reversal
Type : Bullish
Timeframe : Daily
MACD indicator is back over 0
Type : Bullish
Timeframe : Daily
No signals are given by Central Patterns, a market scanner specialised in chart patterns, resistances and supports.
Central Candlesticks, the scanner specialised in Japanese candlesticks, detects a bullish signal that could support the hypothesis of a small rebound in the very short term:
Bullish engulfing lines
Type : Bullish
Timeframe : Daily
| S3 | S2 | S1 | Price | R1 | R2 | R3 | |
|---|---|---|---|---|---|---|---|
| ProTrendLines | 7.83 | 8.91 | 9.85 | 10.98 | 11.26 | 12.07 | 12.91 |
| Change (%) | -28.69% | -18.85% | -10.29% | - | +2.55% | +9.93% | +17.58% |
| Change | -3.15 | -2.07 | -1.13 | - | +0.28 | +1.09 | +1.93 |
| Level | Minor | Major | Major | - | Intermediate | Major | Major |
To determine price objectives, it is also possible to use the pivot points. Here is the price position in relation to pivot points:
| Pivot points | S3 | S2 | S1 | PP | R1 | R2 | R3 |
|---|---|---|---|---|---|---|---|
| Standard | 9.53 | 9.89 | 10.43 | 10.79 | 11.33 | 11.69 | 12.23 |
| Camarilla | 10.73 | 10.82 | 10.90 | 10.98 | 11.06 | 11.15 | 11.23 |
| Woodie | 9.63 | 9.94 | 10.53 | 10.84 | 11.43 | 11.74 | 12.33 |
| Fibonacci | 9.89 | 10.23 | 10.44 | 10.79 | 11.13 | 11.34 | 11.69 |
| Pivot points | S3 | S2 | S1 | PP | R1 | R2 | R3 |
|---|---|---|---|---|---|---|---|
| Standard | 8.20 | 8.82 | 9.90 | 10.52 | 11.60 | 12.22 | 13.30 |
| Camarilla | 10.51 | 10.67 | 10.82 | 10.98 | 11.14 | 11.29 | 11.45 |
| Woodie | 8.43 | 8.94 | 10.13 | 10.64 | 11.83 | 12.34 | 13.53 |
| Fibonacci | 8.82 | 9.47 | 9.87 | 10.52 | 11.17 | 11.57 | 12.22 |
| Pivot points | S3 | S2 | S1 | PP | R1 | R2 | R3 |
|---|---|---|---|---|---|---|---|
| Standard | 3.26 | 5.98 | 7.61 | 10.33 | 11.96 | 14.68 | 16.31 |
| Camarilla | 8.04 | 8.44 | 8.84 | 9.24 | 9.64 | 10.04 | 10.44 |
| Woodie | 2.72 | 5.71 | 7.07 | 10.06 | 11.42 | 14.41 | 15.77 |
| Fibonacci | 5.98 | 7.64 | 8.67 | 10.33 | 11.99 | 13.02 | 14.68 |
Numerical data
The following is the status of the technical indicators and moving averages at the time of publication of this technical analysis:
| RSI (14): | 60.42 | |
| MACD (12,26,9): | 0.0200 | |
| Directional Movement: | 11.89 | |
| AROON (14): | 85.71 | |
| DEMA (21): | 10.07 | |
| Parabolic SAR (0,02-0,02-0,2): | 9.03 | |
| Elder Ray (13): | 0.60 | |
| Super Trend (3,10): | 8.79 | |
| Zig ZAG (10): | 10.98 | |
| VORTEX (21): | 0.8300 | |
| Stochastique (14,3,5): | 84.27 | |
| TEMA (21): | 10.00 | |
| Williams %R (14): | -6.56 | |
| Chande Momentum Oscillator (20): | 1.89 | |
| Repulse (5,40,3): | 9.7800 | |
| ROCnROLL: | 1 | |
| TRIX (15,9): | -0.2400 | |
| Courbe Coppock: | 4.83 |
| MA7: | 10.11 | |
| MA20: | 9.86 | |
| MA50: | 10.15 | |
| MA100: | 9.53 | |
| MAexp7: | 10.28 | |
| MAexp20: | 10.08 | |
| MAexp50: | 9.96 | |
| MAexp100: | 10.03 | |
| Price / MA7: | +8.61% | |
| Price / MA20: | +11.36% | |
| Price / MA50: | +8.18% | |
| Price / MA100: | +15.22% | |
| Price / MAexp7: | +6.81% | |
| Price / MAexp20: | +8.93% | |
| Price / MAexp50: | +10.24% | |
| Price / MAexp100: | +9.47% |
News
Don't forget to follow the news on NEOGENOMICS INC.. At the time of publication of this analysis, the latest news was as follows:
- NEOGENOMICS SHAREHOLDER ALERT: CLAIMSFILER REMINDS INVESTORS WITH LOSSES IN EXCESS OF $100,000 of Lead Plaintiff Deadline in Class Action Lawsuit Against NeoGenomics, Inc. - NEO
- NEO SHAREHOLDER ALERT: Jakubowitz Law Reminds NeoGenomics Shareholders of a Lead Plaintiff Deadline of February 6, 2023
- NEO LAWSUIT ALERT: Levi & Korsinsky Notifies NeoGenomics, Inc. Investors of a Class Action Lawsuit and Upcoming Deadline
- NEO Investors Have Opportunity to Lead NeoGenomics, Inc. Securities Fraud Lawsuit
- NEOGENOMICS, INC. (NASDAQ: NEO) SHAREHOLDER CLASS ACTION ALERT: Bernstein Liebhard LLP Reminds Investors of the Deadline to File a Lead Plaintiff Motion in a Securities Class Action Lawsuit Against NeoGenomics, Inc. (NASDAQ: NEO)
About author

Online


Add a comment
Comments
0 comments on the analysis NEOGENOMICS INC. - Daily