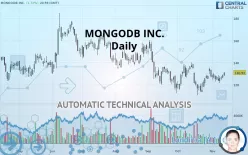
MONGODB INC. - Daily - Technical analysis published on 11/14/2019 (GMT)
- 441
- 0
- Who voted?
Click here for a new analysis!
- Timeframe : Daily
- - Analysis generated on
- Status : TARGET REACHED

Summary of the analysis

Additional analysis
Quotes
MONGODB INC. rating 130.93 USD. On the day, this instrument gained +1.72% with the lowest point at 128.04 USD and the highest point at 131.20 USD. The deviation from the price is +2.26% for the low point and -0.21% for the high point.The Central Gaps scanner detects a bullish opening marking the presence of buyers ahead of sellers at the opening but not sufficiently marked to allow the price to register a quotation gap.
Bullish opening
Type : Bullish
Timeframe : Openning
So that you have an overall view of the price change, here is a table showing the variations over several periods:
Technical
Technical analysis of this Daily chart of MONGODB INC. indicates that the overall trend is slightly bearish. Only 57.14% of the signals given by moving averages are bearish. This slightly bearish trend could quickly be reversed due to the strong bullish signals currently being given by short-term moving averages. The Central Indicators scanner detects a bullish signal on moving averages that could impact this trend:
Bullish price crossover with Moving Average 50
Type : Bullish
Timeframe : Daily
The probability of a further increase are moderate given the direction of the technical indicators.
Caution: the Central Indicators scanner currently detects an excess:
Williams %R indicator is overbought : over -20
Type : Neutral
Timeframe : Daily
Pivot points : price is over resistance 1
Type : Neutral
Timeframe : Daily
Pivot points : price is over resistance 1
Type : Neutral
Timeframe : Weekly
RSI indicator is back over 50
Type : Bullish
Timeframe : Daily
Price is back under the pivot point
Type : Bearish
Timeframe : Weekly
Central Patterns, the market scanner focusing on chart patterns, resistances and supports found these results:
Near resistance of triangle
Type : Bearish
Timeframe : Daily
Horizontal resistance is broken
Type : Bullish
Timeframe : Daily
Central Candlesticks, the scanner specialised in Japanese candlesticks, detects a bullish signal that could support the hypothesis of a small rebound in the very short term:
Three white soldiers
Type : Bullish
Timeframe : Daily
| S3 | S2 | S1 | Price | R1 | R2 | R3 | |
|---|---|---|---|---|---|---|---|
| ProTrendLines | 107.92 | 114.77 | 125.38 | 130.93 | 135.88 | 147.78 | 154.64 |
| Change (%) | -17.57% | -12.34% | -4.24% | - | +3.78% | +12.87% | +18.11% |
| Change | -23.01 | -16.16 | -5.55 | - | +4.95 | +16.85 | +23.71 |
| Level | Minor | Intermediate | Major | - | Major | Minor | Intermediate |
Attention could also be paid to pivot points to set price objectives:
| Pivot points | S3 | S2 | S1 | PP | R1 | R2 | R3 |
|---|---|---|---|---|---|---|---|
| Standard | 123.33 | 124.67 | 126.69 | 128.03 | 130.05 | 131.39 | 133.41 |
| Camarilla | 127.80 | 128.10 | 128.41 | 128.72 | 129.03 | 129.34 | 129.64 |
| Woodie | 123.68 | 124.84 | 127.04 | 128.20 | 130.40 | 131.56 | 133.76 |
| Fibonacci | 124.67 | 125.95 | 126.74 | 128.03 | 129.31 | 130.10 | 131.39 |
| Pivot points | S3 | S2 | S1 | PP | R1 | R2 | R3 |
|---|---|---|---|---|---|---|---|
| Standard | 112.20 | 116.89 | 121.51 | 126.21 | 130.83 | 135.52 | 140.14 |
| Camarilla | 123.57 | 124.42 | 125.28 | 126.13 | 126.98 | 127.84 | 128.69 |
| Woodie | 112.16 | 116.87 | 121.47 | 126.19 | 130.79 | 135.50 | 140.10 |
| Fibonacci | 116.89 | 120.45 | 122.65 | 126.21 | 129.76 | 131.96 | 135.52 |
| Pivot points | S3 | S2 | S1 | PP | R1 | R2 | R3 |
|---|---|---|---|---|---|---|---|
| Standard | 82.43 | 96.52 | 112.15 | 126.24 | 141.86 | 155.95 | 171.57 |
| Camarilla | 119.60 | 122.32 | 125.05 | 127.77 | 130.49 | 133.22 | 135.94 |
| Woodie | 83.20 | 96.90 | 112.91 | 126.62 | 142.63 | 156.33 | 172.34 |
| Fibonacci | 96.52 | 107.87 | 114.88 | 126.24 | 137.59 | 144.60 | 155.95 |
Numerical data
The following are the details of the technical indicators and moving averages that were collected to generate this technical analysis:
| RSI (14): | 54.77 | |
| MACD (12,26,9): | -0.0400 | |
| Directional Movement: | -2.50 | |
| AROON (14): | 28.57 | |
| DEMA (21): | 126.33 | |
| Parabolic SAR (0,02-0,02-0,2): | 115.14 | |
| Elder Ray (13): | 2.56 | |
| Super Trend (3,10): | 138.00 | |
| Zig ZAG (10): | 130.93 | |
| VORTEX (21): | 0.9200 | |
| Stochastique (14,3,5): | 65.28 | |
| TEMA (21): | 128.31 | |
| Williams %R (14): | -26.42 | |
| Chande Momentum Oscillator (20): | 2.91 | |
| Repulse (5,40,3): | 4.4400 | |
| ROCnROLL: | -1 | |
| TRIX (15,9): | -0.0900 | |
| Courbe Coppock: | 10.50 |
| MA7: | 126.92 | |
| MA20: | 124.58 | |
| MA50: | 127.95 | |
| MA100: | 139.03 | |
| MAexp7: | 127.83 | |
| MAexp20: | 126.90 | |
| MAexp50: | 129.90 | |
| MAexp100: | 133.29 | |
| Price / MA7: | +3.16% | |
| Price / MA20: | +5.10% | |
| Price / MA50: | +2.33% | |
| Price / MA100: | -5.83% | |
| Price / MAexp7: | +2.43% | |
| Price / MAexp20: | +3.18% | |
| Price / MAexp50: | +0.79% | |
| Price / MAexp100: | -1.77% |
News
The last news published on MONGODB INC. at the time of the generation of this analysis was as follows:
- MongoDB and Girls in Tech Join Forces to Empower Women in Ireland
- MongoDB and Girls in Tech Join Forces to Empower Women in Ireland
- MongoDB and Google Cloud Announce Expanded Partnership on Cloud Services
- MongoDB Hires Lena Smart as Chief Information Security Officer
- MongoDB Named a Leader by Independent Research Firm
About author

Online


Add a comment
Comments
0 comments on the analysis MONGODB INC. - Daily