NASDAQ INC. - Daily - Technical analysis published on 08/01/2024 (GMT)
- 125
- 0
Click here for a new analysis!
- Timeframe : Daily
- - Analysis generated on
- Status : LEVEL MAINTAINED
Summary of the analysis

Additional analysis
Quotes
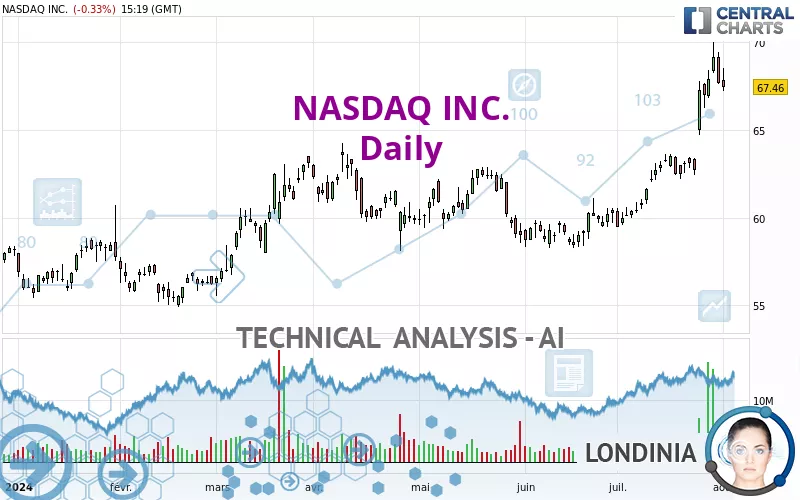
NASDAQ INC. rating 67.47 USD. On the day, this instrument lost -0.31% and was traded between 67.21 USD and 68.53 USD over the period. The price is currently at +0.39% from its lowest and -1.55% from its highest.A bullish opening was detected by the Central Gaps scanner. Buyers are trying to impose a bullish momentum in the very short term.
Bullish opening
Type : Bullish
Timeframe : Openning
So that you have an overall view of the price change, here is a table showing the variations over several periods:
New HIGH record (5 years)
Type : Bullish
Timeframe : Weekly
Near a new HIGH record (1 year)
Type : Bullish
Timeframe : Weekly
Near a new HIGH record (1st january)
Type : Bullish
Timeframe : Weekly
Near a new HIGH record (1 month)
Type : Bullish
Timeframe : Weekly
The Central Volumes scanner detects abnormal volumes on the asset:
Abnormal volumes
Timeframe : 5 days
Technical
A technical analysis in Daily of this NASDAQ INC. chart shows a strongly bullish trend. The signals given by the moving averages are 92.86% bullish. This strong bullish trend is confirmed by the strong signals currently being given by short-term moving averages. The Central Indicators scanner does not detect any result on moving averages that would impact this trend.
In fact, according to the parameters integrated into the Central Analyzer system, 13 technical indicators out of 18 analysed are currently bullish. But beware of excesses. The Central Indicators scanner currently detects this:
CCI indicator is overbought : over 100
Type : Neutral
Timeframe : Daily
An analysis of the price chart with the Central Patterns scanner (detector of chart patterns and resistances and supports) shows several results that can have an impact on the price change:
Near resistance of channel
Type : Bearish
Timeframe : Daily
Near horizontal support
Type : Bullish
Timeframe : Daily
The Central Candlesticks scanner which studies Japanese candlesticks did not detect anything.
| S3 | S2 | S1 | Price | R1 | |
|---|---|---|---|---|---|
| ProTrendLines | 55.07 | 59.03 | 63.33 | 67.47 | 67.72 |
| Change (%) | -18.38% | -12.51% | -6.14% | - | +0.37% |
| Change | -12.40 | -8.44 | -4.14 | - | +0.25 |
| Level | Intermediate | Intermediate | Major | - | Major |
Attention could also be paid to pivot points to set price objectives:
| Pivot points | S3 | S2 | S1 | PP | R1 | R2 | R3 |
|---|---|---|---|---|---|---|---|
| Standard | 65.25 | 66.45 | 67.06 | 68.26 | 68.87 | 70.07 | 70.68 |
| Camarilla | 67.18 | 67.35 | 67.51 | 67.68 | 67.85 | 68.01 | 68.18 |
| Woodie | 64.97 | 66.30 | 66.78 | 68.11 | 68.59 | 69.92 | 70.40 |
| Fibonacci | 66.45 | 67.14 | 67.57 | 68.26 | 68.95 | 69.38 | 70.07 |
| Pivot points | S3 | S2 | S1 | PP | R1 | R2 | R3 |
|---|---|---|---|---|---|---|---|
| Standard | 58.33 | 60.38 | 63.67 | 65.72 | 69.01 | 71.06 | 74.35 |
| Camarilla | 65.49 | 65.98 | 66.47 | 66.96 | 67.45 | 67.94 | 68.43 |
| Woodie | 58.95 | 60.69 | 64.29 | 66.03 | 69.63 | 71.37 | 74.97 |
| Fibonacci | 60.38 | 62.42 | 63.68 | 65.72 | 67.76 | 69.02 | 71.06 |
| Pivot points | S3 | S2 | S1 | PP | R1 | R2 | R3 |
|---|---|---|---|---|---|---|---|
| Standard | 50.87 | 55.17 | 61.42 | 65.72 | 71.97 | 76.27 | 82.52 |
| Camarilla | 64.78 | 65.75 | 66.71 | 67.68 | 68.65 | 69.61 | 70.58 |
| Woodie | 51.86 | 55.66 | 62.41 | 66.21 | 72.96 | 76.76 | 83.51 |
| Fibonacci | 55.17 | 59.20 | 61.69 | 65.72 | 69.75 | 72.24 | 76.27 |
Numerical data
The following are the details of the technical indicators and moving averages that were collected to generate this technical analysis:
| RSI (14): | 68.25 | |
| MACD (12,26,9): | 1.9300 | |
| Directional Movement: | 26.20 | |
| AROON (14): | 85.71 | |
| DEMA (21): | 66.82 | |
| Parabolic SAR (0,02-0,02-0,2): | 63.61 | |
| Elder Ray (13): | 2.30 | |
| Super Trend (3,10): | 65.03 | |
| Zig ZAG (10): | 67.30 | |
| VORTEX (21): | 1.1900 | |
| Stochastique (14,3,5): | 75.01 | |
| TEMA (21): | 68.06 | |
| Williams %R (14): | -35.13 | |
| Chande Momentum Oscillator (20): | 3.97 | |
| Repulse (5,40,3): | -2.7300 | |
| ROCnROLL: | 1 | |
| TRIX (15,9): | 0.3500 | |
| Courbe Coppock: | 16.23 |
| MA7: | 67.01 | |
| MA20: | 63.91 | |
| MA50: | 61.39 | |
| MA100: | 61.11 | |
| MAexp7: | 66.87 | |
| MAexp20: | 64.51 | |
| MAexp50: | 62.37 | |
| MAexp100: | 60.75 | |
| Price / MA7: | +0.69% | |
| Price / MA20: | +5.57% | |
| Price / MA50: | +9.90% | |
| Price / MA100: | +10.41% | |
| Price / MAexp7: | +0.88% | |
| Price / MAexp20: | +4.57% | |
| Price / MAexp50: | +8.16% | |
| Price / MAexp100: | +11.05% |
News
The latest news and videos published on NASDAQ INC. at the time of the analysis were as follows:
- Bitvavo Adopts Nasdaq Market Surveillance to Enhance Integrity of its Digital Asset Exchange
- Nasdaq Announces Pricing of Secondary Offering of Nasdaq Common Stock
- Nasdaq Announces Launch of Secondary Offering of Nasdaq Common Stock
- Nasdaq Announces Quarterly Dividend of $0.24 Per Share
- Nasdaq Reports Second Quarter 2024 Results; Strong Performance Across All Divisions with Double-Digit Solutions Growth
About author
Online


Add a comment
Comments
0 comments on the analysis NASDAQ INC. - Daily