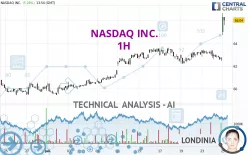
NASDAQ INC. - 1H - Technical analysis published on 07/25/2024 (GMT)
- 178
- 0
Click here for a new analysis!
- Timeframe : 1H
- - Analysis generated on
- Status : TARGET REACHED

Summary of the analysis

Additional analysis
Quotes
The NASDAQ INC. rating is 66.66 USD. The price registered an increase of +6.27% on the session and was traded between 64.72 USD and 66.66 USD over the period. The price is currently at +3.00% from its lowest and 0% from its highest.A bullish gap was detected at the opening by the Central Gaps scanner. There are a lot of buyers and they have the upper hand in the very short term.
Opening Gap UP
Type : Bullish
Timeframe : Openning
A study of price movements over other periods shows the following variations:
Near a new HIGH record (1 year)
Type : Bullish
Timeframe : Weekly
Near a new HIGH record (1st january)
Type : Bullish
Timeframe : Weekly
Near a new LOW record (1 month)
Type : Bearish
Timeframe : Weekly
Technical
A technical analysis in 1H of this NASDAQ INC. chart shows a strongly bullish trend. 92.86% of the signals given by moving averages are bullish. The overall trend is supported by the strong bullish signals from short-term moving averages. An assessment of moving averages reveals several bullish signals that could impact this trend:
Moving Average bullish crossovers : AMA20 & AMA50
Type : Bullish
Timeframe : 1 hour
Bullish price crossover with Moving Average 20
Type : Bullish
Timeframe : 1 hour
Bullish price crossover with Moving Average 50
Type : Bullish
Timeframe : 1 hour
Bullish price crossover with adaptative moving average 20
Type : Bullish
Timeframe : 1 hour
Bullish price crossover with adaptative moving average 50
Type : Bullish
Timeframe : 1 hour
Technical indicators are strongly bullish, suggesting that the price increase should continue.
But beware of excesses. The Central Indicators scanner currently detects this:
RSI indicator is overbought : over 70
Type : Neutral
Timeframe : 1 hour
CCI indicator is overbought : over 100
Type : Neutral
Timeframe : 1 hour
Williams %R indicator is overbought : over -20
Type : Neutral
Timeframe : 1 hour
Pivot points : price is over resistance 3
Type : Neutral
Timeframe : 1 hour
MACD crosses UP its Moving Average
Type : Bullish
Timeframe : 1 hour
Parabolic SAR indicator bullish reversal
Type : Bullish
Timeframe : 1 hour
Aroon indicator bullish trend
Type : Bullish
Timeframe : 1 hour
Ichimoku : price is over the cloud
Type : Bullish
Timeframe : 1 hour
SuperTrend indicator bullish reversal
Type : Bullish
Timeframe : 1 hour
MACD indicator is back over 0
Type : Bullish
Timeframe : 1 hour
Price is back under the pivot point
Type : Bearish
Timeframe : Weekly
Momentum indicator is back over 0
Type : Bullish
Timeframe : 1 hour
The Central Patterns scanner, which studies chart patterns, resistances and supports, has identified this signal:
Resistance of channel is broken
Type : Bullish
Timeframe : 1 hour
For a small rebound in the very short term, the Central Candlesticks scanner currently notes the presence of these bullish patterns in Japanese candlesticks:
White morning star
Type : Bullish
Timeframe : 1 hour
Upside gap
Type : Bullish
Timeframe : 1 hour
Long white line
Type : Bullish
Timeframe : 1 hour
| S3 | S2 | S1 | Price | R1 | |
|---|---|---|---|---|---|
| ProTrendLines | 62.21 | 62.85 | 63.33 | 66.66 | 67.72 |
| Change (%) | -6.68% | -5.72% | -5.00% | - | +1.59% |
| Change | -4.45 | -3.81 | -3.33 | - | +1.06 |
| Level | Minor | Minor | Major | - | Major |
To determine price objectives, it is also possible to use the pivot points. Here is the price position in relation to pivot points:
| Pivot points | S3 | S2 | S1 | PP | R1 | R2 | R3 |
|---|---|---|---|---|---|---|---|
| Standard | 61.35 | 61.89 | 62.31 | 62.85 | 63.27 | 63.81 | 64.23 |
| Camarilla | 62.47 | 62.55 | 62.64 | 62.73 | 62.82 | 62.91 | 62.99 |
| Woodie | 61.29 | 61.86 | 62.25 | 62.82 | 63.21 | 63.78 | 64.17 |
| Fibonacci | 61.89 | 62.26 | 62.48 | 62.85 | 63.22 | 63.44 | 63.81 |
| Pivot points | S3 | S2 | S1 | PP | R1 | R2 | R3 |
|---|---|---|---|---|---|---|---|
| Standard | 60.54 | 61.38 | 61.94 | 62.78 | 63.34 | 64.18 | 64.74 |
| Camarilla | 62.13 | 62.25 | 62.38 | 62.51 | 62.64 | 62.77 | 62.90 |
| Woodie | 60.41 | 61.31 | 61.81 | 62.71 | 63.21 | 64.11 | 64.61 |
| Fibonacci | 61.38 | 61.91 | 62.24 | 62.78 | 63.31 | 63.64 | 64.18 |
| Pivot points | S3 | S2 | S1 | PP | R1 | R2 | R3 |
|---|---|---|---|---|---|---|---|
| Standard | 55.44 | 56.74 | 58.50 | 59.80 | 61.56 | 62.86 | 64.62 |
| Camarilla | 59.42 | 59.70 | 59.98 | 60.26 | 60.54 | 60.82 | 61.10 |
| Woodie | 55.67 | 56.86 | 58.73 | 59.92 | 61.79 | 62.98 | 64.85 |
| Fibonacci | 56.74 | 57.91 | 58.63 | 59.80 | 60.97 | 61.69 | 62.86 |
Numerical data
The following is the status of the technical indicators and moving averages at the time of publication of this technical analysis:
| RSI (14): | 81.63 | |
| MACD (12,26,9): | 0.2300 | |
| Directional Movement: | 40.44 | |
| AROON (14): | 7.14 | |
| DEMA (21): | 63.49 | |
| Parabolic SAR (0,02-0,02-0,2): | 62.43 | |
| Elder Ray (13): | 2.21 | |
| Super Trend (3,10): | 63.61 | |
| Zig ZAG (10): | 66.19 | |
| VORTEX (21): | 1.0200 | |
| Stochastique (14,3,5): | 42.05 | |
| TEMA (21): | 63.62 | |
| Williams %R (14): | -5.16 | |
| Chande Momentum Oscillator (20): | 3.02 | |
| Repulse (5,40,3): | 2.2000 | |
| ROCnROLL: | 1 | |
| TRIX (15,9): | 0.0100 | |
| Courbe Coppock: | 0.94 |
| MA7: | 63.37 | |
| MA20: | 61.90 | |
| MA50: | 60.74 | |
| MA100: | 60.59 | |
| MAexp7: | 63.66 | |
| MAexp20: | 63.22 | |
| MAexp50: | 62.93 | |
| MAexp100: | 62.32 | |
| Price / MA7: | +5.19% | |
| Price / MA20: | +7.69% | |
| Price / MA50: | +9.75% | |
| Price / MA100: | +10.02% | |
| Price / MAexp7: | +4.71% | |
| Price / MAexp20: | +5.44% | |
| Price / MAexp50: | +5.93% | |
| Price / MAexp100: | +6.96% |
News
The latest news and videos published on NASDAQ INC. at the time of the analysis were as follows:
- Nasdaq Announces Quarterly Dividend of $0.24 Per Share
- Nasdaq Reports Second Quarter 2024 Results; Strong Performance Across All Divisions with Double-Digit Solutions Growth
- Nasdaq Announces Mid-Month Open Short Interest Positions in Nasdaq Stocks as of Settlement Date July 15, 2024
- Delisting of Securities of CONX Corp.; Priveterra Acquisition Corp. II; Yield10 Bioscience, Inc.; Aesthetic Medical International Holdings Group Ltd.; Breeze Holdings Acquisition Corp.; Quadro Acquisition One Corp.; DermTech, Inc.; TRACON Pharmaceuticals, Inc.; eFFECTOR Therapeutics, Inc.; Dynatronics Corporation; and Canna-Global Acquisition Corp. from The Nasdaq Stock Market
- Super Micro Computer Inc. to Join the Nasdaq-100 Index® Beginning July 22, 2024
About author
Online


Add a comment
Comments
0 comments on the analysis NASDAQ INC. - 1H