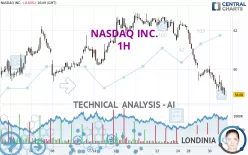
NASDAQ INC. - 1H - Technical analysis published on 05/31/2024 (GMT)
- 171
- 0
Click here for a new analysis!
- Timeframe : 1H
- - Analysis generated on
- Status : TARGET REACHED

Summary of the analysis

Additional analysis
Quotes
NASDAQ INC. rating 58.98 USD. On the day, this instrument lost -0.12% and was traded between 58.76 USD and 59.70 USD over the period. The price is currently at +0.37% from its lowest and -1.21% from its highest.A bullish opening was detected by the Central Gaps scanner. Buyers are trying to impose a bullish momentum in the very short term.
Bullish opening
Type : Bullish
Timeframe : Openning
So that you have an overall view of the price change, here is a table showing the variations over several periods:
New LOW record (1 month)
Type : Bearish
Timeframe : Weekly
Technical
Technical analysis of this 1H chart of NASDAQ INC. indicates that the overall trend is strongly bearish. The signals given by moving averages are 92.86% bearish. This strong bearish trend is confirmed by the strong signals currently being given by short-term moving averages. The Central Indicators market scanner currently does not detect any result that concerns moving averages.
An assessment of technical indicators does not currently provide any relevant information to suggest whether the signal given by the technical indicators is more bullish or bearish.
But beware of excesses. The Central Indicators scanner currently detects this:
RSI indicator is oversold : under 30
Type : Neutral
Timeframe : 1 hour
CCI indicator is oversold : under -100
Type : Neutral
Timeframe : 1 hour
Williams %R indicator is oversold : under -80
Type : Neutral
Timeframe : 1 hour
Pivot points : price is under support 3
Type : Neutral
Timeframe : Weekly
MACD crosses UP its Moving Average
Type : Bullish
Timeframe : 1 hour
The analysis of the price chart with Central Patterns scanners does not return any result.
Central Candlesticks, the scanner specialised in Japanese candlesticks, detects these bearish signals that could support the hypothesis of a small drop in the very short term:
Bearish harami
Type : Bearish
Timeframe : 1 hour
Bearish harami cross
Type : Bearish
Timeframe : 1 hour
| S3 | S2 | S1 | Price | R1 | R2 | R3 | |
|---|---|---|---|---|---|---|---|
| ProTrendLines | 55.22 | 56.90 | 58.40 | 58.98 | 59.38 | 59.89 | 60.87 |
| Change (%) | -6.38% | -3.53% | -0.98% | - | +0.68% | +1.54% | +3.20% |
| Change | -3.76 | -2.08 | -0.58 | - | +0.40 | +0.91 | +1.89 |
| Level | Intermediate | Intermediate | Major | - | Major | Major | Minor |
To determine price objectives, it is also possible to use the pivot points. Here is the price position in relation to pivot points:
| Pivot points | S3 | S2 | S1 | PP | R1 | R2 | R3 |
|---|---|---|---|---|---|---|---|
| Standard | 57.23 | 58.04 | 58.54 | 59.35 | 59.85 | 60.66 | 61.16 |
| Camarilla | 58.69 | 58.81 | 58.93 | 59.05 | 59.17 | 59.29 | 59.41 |
| Woodie | 57.09 | 57.96 | 58.40 | 59.27 | 59.71 | 60.58 | 61.02 |
| Fibonacci | 58.04 | 58.54 | 58.85 | 59.35 | 59.85 | 60.16 | 60.66 |
| Pivot points | S3 | S2 | S1 | PP | R1 | R2 | R3 |
|---|---|---|---|---|---|---|---|
| Standard | 60.05 | 60.76 | 61.49 | 62.20 | 62.93 | 63.64 | 64.37 |
| Camarilla | 61.83 | 61.97 | 62.10 | 62.23 | 62.36 | 62.49 | 62.63 |
| Woodie | 60.07 | 60.77 | 61.51 | 62.21 | 62.95 | 63.65 | 64.39 |
| Fibonacci | 60.76 | 61.31 | 61.65 | 62.20 | 62.75 | 63.09 | 63.64 |
| Pivot points | S3 | S2 | S1 | PP | R1 | R2 | R3 |
|---|---|---|---|---|---|---|---|
| Standard | 51.07 | 54.58 | 57.22 | 60.73 | 63.37 | 66.88 | 69.52 |
| Camarilla | 58.16 | 58.72 | 59.29 | 59.85 | 60.41 | 60.98 | 61.54 |
| Woodie | 50.63 | 54.36 | 56.78 | 60.51 | 62.93 | 66.66 | 69.08 |
| Fibonacci | 54.58 | 56.93 | 58.38 | 60.73 | 63.08 | 64.53 | 66.88 |
Numerical data
The following are the details of the technical indicators and moving averages that were collected to generate this technical analysis:
| RSI (14): | 25.09 | |
| MACD (12,26,9): | -0.6100 | |
| Directional Movement: | -23.94 | |
| AROON (14): | -64.29 | |
| DEMA (21): | 58.97 | |
| Parabolic SAR (0,02-0,02-0,2): | 59.77 | |
| Elder Ray (13): | -0.54 | |
| Super Trend (3,10): | 60.00 | |
| Zig ZAG (10): | 59.09 | |
| VORTEX (21): | 0.6800 | |
| Stochastique (14,3,5): | 21.92 | |
| TEMA (21): | 58.80 | |
| Williams %R (14): | -75.54 | |
| Chande Momentum Oscillator (20): | -0.85 | |
| Repulse (5,40,3): | -0.3300 | |
| ROCnROLL: | 2 | |
| TRIX (15,9): | -0.1500 | |
| Courbe Coppock: | 2.73 |
| MA7: | 60.61 | |
| MA20: | 61.03 | |
| MA50: | 61.20 | |
| MA100: | 59.26 | |
| MAexp7: | 59.15 | |
| MAexp20: | 59.77 | |
| MAexp50: | 60.63 | |
| MAexp100: | 60.98 | |
| Price / MA7: | -2.69% | |
| Price / MA20: | -3.36% | |
| Price / MA50: | -3.63% | |
| Price / MA100: | -0.47% | |
| Price / MAexp7: | -0.29% | |
| Price / MAexp20: | -1.32% | |
| Price / MAexp50: | -2.72% | |
| Price / MAexp100: | -3.28% |
News
Don't forget to follow the news on NASDAQ INC.. At the time of publication of this analysis, the latest news was as follows:
- Nasdaq Collaborates with Microsoft to Reimagine the Boardroom Experience using Artificial Intelligence
- Nasdaq and FIA Tech Partner to Reduce Complexity and Increase Resiliency of Post Trade Infrastructure
- Nasdaq Announces Mid-Month Open Short Interest Positions in Nasdaq Stocks as of Settlement Date May 15, 2024
- Delisting of Securities of Better Therapeutics, Inc.; Tritium DCFC Limited; Arcimoto, Inc.; Next.e.GO N.V.; Acutus Medical, Inc.; and NeuBase Therapeutics, Inc. from The Nasdaq Stock Market
- Nasdaq to Enhance Global Market Surveillance Offering with Generative AI
About author
Online


Add a comment
Comments
0 comments on the analysis NASDAQ INC. - 1H