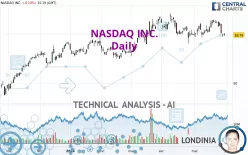
NASDAQ INC. - Daily - Technical analysis published on 05/30/2024 (GMT)
- 107
- 0
Click here for a new analysis!
- Timeframe : Daily
- - Analysis generated on
- Status : LEVEL MAINTAINED

Summary of the analysis

Additional analysis
Quotes
The NASDAQ INC. rating is 59.79 USD. On the day, this instrument lost -0.10% and was traded between 59.51 USD and 60.15 USD over the period. The price is currently at +0.47% from its lowest and -0.60% from its highest.The Central Gaps scanner detects a bullish opening marking the presence of buyers ahead of sellers at the opening but not sufficiently marked to allow the price to register a quotation gap.
Bullish opening
Type : Bullish
Timeframe : Openning
A study of price movements over other periods shows the following variations:
Near a new HIGH record (1 month)
Type : Bullish
Timeframe : Weekly
Technical
A technical analysis in Daily of this NASDAQ INC. chart shows a neutral trend. The strong bearish signals currently being given by short-term moving averages could allow the overall trend to return to a bearish trend. The Central Indicators market scanner is currently detecting a bearish signal that could impact this trend:
Bearish trend reversal : Moving Average 50
Type : Bearish
Timeframe : Daily
Technical indicators are bearish. There is still some doubt about the decline in the price.
But beware of excesses. The Central Indicators scanner currently detects this:
CCI indicator is oversold : under -100
Type : Neutral
Timeframe : Daily
Williams %R indicator is oversold : under -80
Type : Neutral
Timeframe : Daily
Pivot points : price is under support 3
Type : Neutral
Timeframe : Weekly
MACD indicator is back under 0
Type : Bearish
Timeframe : Daily
Price is back under the pivot point
Type : Bearish
Timeframe : Daily
The Central Patterns scanner, which studies chart patterns, resistances and supports, has identified these signals:
Horizontal support is broken
Type : Bearish
Timeframe : Daily
Support of triangle is broken
Type : Bearish
Timeframe : Daily
The presence of a bearish pattern in Japanese candlesticks detected by Central Candlesticks that could cause a correction in the very short term was also detected:
Bearish engulfing lines
Type : Bearish
Timeframe : Daily
| S3 | S2 | S1 | Price | R1 | R2 | R3 | |
|---|---|---|---|---|---|---|---|
| ProTrendLines | 52.80 | 55.22 | 56.90 | 59.79 | 59.89 | 61.55 | 63.64 |
| Change (%) | -11.69% | -7.64% | -4.83% | - | +0.17% | +2.94% | +6.44% |
| Change | -6.99 | -4.57 | -2.89 | - | +0.10 | +1.76 | +3.85 |
| Level | Intermediate | Minor | Intermediate | - | Major | Intermediate | Intermediate |
To determine price objectives, it is also possible to use the pivot points. Here is the price position in relation to pivot points:
| Pivot points | S3 | S2 | S1 | PP | R1 | R2 | R3 |
|---|---|---|---|---|---|---|---|
| Standard | 58.85 | 59.12 | 59.49 | 59.76 | 60.13 | 60.40 | 60.77 |
| Camarilla | 59.67 | 59.73 | 59.79 | 59.85 | 59.91 | 59.97 | 60.03 |
| Woodie | 58.89 | 59.15 | 59.53 | 59.79 | 60.17 | 60.43 | 60.81 |
| Fibonacci | 59.12 | 59.37 | 59.52 | 59.76 | 60.01 | 60.16 | 60.40 |
| Pivot points | S3 | S2 | S1 | PP | R1 | R2 | R3 |
|---|---|---|---|---|---|---|---|
| Standard | 60.05 | 60.76 | 61.49 | 62.20 | 62.93 | 63.64 | 64.37 |
| Camarilla | 61.83 | 61.97 | 62.10 | 62.23 | 62.36 | 62.49 | 62.63 |
| Woodie | 60.07 | 60.77 | 61.51 | 62.21 | 62.95 | 63.65 | 64.39 |
| Fibonacci | 60.76 | 61.31 | 61.65 | 62.20 | 62.75 | 63.09 | 63.64 |
| Pivot points | S3 | S2 | S1 | PP | R1 | R2 | R3 |
|---|---|---|---|---|---|---|---|
| Standard | 51.07 | 54.58 | 57.22 | 60.73 | 63.37 | 66.88 | 69.52 |
| Camarilla | 58.16 | 58.72 | 59.29 | 59.85 | 60.41 | 60.98 | 61.54 |
| Woodie | 50.63 | 54.36 | 56.78 | 60.51 | 62.93 | 66.66 | 69.08 |
| Fibonacci | 54.58 | 56.93 | 58.38 | 60.73 | 63.08 | 64.53 | 66.88 |
Numerical data
The following is the status of the technical indicators and moving averages at the time of publication of this technical analysis:
| RSI (14): | 40.61 | |
| MACD (12,26,9): | -0.0200 | |
| Directional Movement: | -8.60 | |
| AROON (14): | -42.86 | |
| DEMA (21): | 61.12 | |
| Parabolic SAR (0,02-0,02-0,2): | 62.71 | |
| Elder Ray (13): | -1.19 | |
| Super Trend (3,10): | 62.91 | |
| Zig ZAG (10): | 59.64 | |
| VORTEX (21): | 0.9800 | |
| Stochastique (14,3,5): | 14.48 | |
| TEMA (21): | 60.87 | |
| Williams %R (14): | -93.14 | |
| Chande Momentum Oscillator (20): | -0.98 | |
| Repulse (5,40,3): | -2.3400 | |
| ROCnROLL: | 2 | |
| TRIX (15,9): | 0.0400 | |
| Courbe Coppock: | 1.91 |
| MA7: | 61.18 | |
| MA20: | 61.12 | |
| MA50: | 61.25 | |
| MA100: | 59.24 | |
| MAexp7: | 60.74 | |
| MAexp20: | 61.06 | |
| MAexp50: | 60.60 | |
| MAexp100: | 59.19 | |
| Price / MA7: | -2.27% | |
| Price / MA20: | -2.18% | |
| Price / MA50: | -2.38% | |
| Price / MA100: | +0.93% | |
| Price / MAexp7: | -1.56% | |
| Price / MAexp20: | -2.08% | |
| Price / MAexp50: | -1.34% | |
| Price / MAexp100: | +1.01% |
News
The latest news and videos published on NASDAQ INC. at the time of the analysis were as follows:
- Nasdaq Collaborates with Microsoft to Reimagine the Boardroom Experience using Artificial Intelligence
- Nasdaq and FIA Tech Partner to Reduce Complexity and Increase Resiliency of Post Trade Infrastructure
- Nasdaq Announces Mid-Month Open Short Interest Positions in Nasdaq Stocks as of Settlement Date May 15, 2024
- Delisting of Securities of Better Therapeutics, Inc.; Tritium DCFC Limited; Arcimoto, Inc.; Next.e.GO N.V.; Acutus Medical, Inc.; and NeuBase Therapeutics, Inc. from The Nasdaq Stock Market
- Nasdaq to Enhance Global Market Surveillance Offering with Generative AI
About author
Online


Add a comment
Comments
0 comments on the analysis NASDAQ INC. - Daily