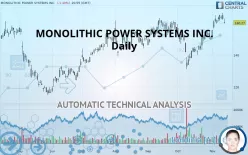
MONOLITHIC POWER SYSTEMS INC. - Daily - Technical analysis published on 11/14/2019 (GMT)
- 398
- 0
- Who voted?
Click here for a new analysis!
- Timeframe : Daily
- - Analysis generated on
- Status : TARGET REACHED

Summary of the analysis

Additional analysis
Quotes
MONOLITHIC POWER SYSTEMS INC. rating 160.27 USD. The price registered a decrease of -1.40% on the session and was traded between 159.65 USD and 162.68 USD over the period. The price is currently at +0.39% from its lowest and -1.48% from its highest.A bearish gap was detected at the opening by the Central Gaps scanner. There are a lot of sellers and they have the upper hand in the very short term.
Opening Gap DOWN
Type : Bearish
Timeframe : Openning
Here is a more detailed summary of the historical variations registered by MONOLITHIC POWER SYSTEMS INC.:
New HIGH record (5 years)
Type : Bullish
Timeframe : Weekly
Near a new HIGH record (1 year)
Type : Bullish
Timeframe : Weekly
Near a new HIGH record (1st january)
Type : Bullish
Timeframe : Weekly
Near a new HIGH record (1 month)
Type : Bullish
Timeframe : Weekly
Technical
A technical analysis in Daily of this MONOLITHIC POWER SYSTEMS INC. chart shows a strongly bullish trend. 92.86% of the signals given by moving averages are bullish. This strongly bullish trend is supported by the strong bullish signals given by short-term moving averages. An assessment of moving averages reveals a bullish signal that could impact this trend:
Moving Average bullish crossovers : MA20 & MA50
Type : Bullish
Timeframe : Daily
An assessment of technical indicators shows a moderate bullish signal.
But beware of excesses. The Central Indicators scanner currently detects this:
CCI indicator is overbought : over 100
Type : Neutral
Timeframe : Daily
Pivot points : price is under support 1
Type : Neutral
Timeframe : Daily
Price is back over the pivot point
Type : Bullish
Timeframe : Weekly
The Central Patterns scanner, which studies chart patterns, resistances and supports, has identified this signal:
Horizontal support is broken
Type : Bearish
Timeframe : Daily
The presence of a bearish pattern in Japanese candlesticks detected by Central Candlesticks that could cause a correction in the very short term was also detected:
Bearish engulfing lines
Type : Bearish
Timeframe : Daily
| S3 | S2 | S1 | Price | R1 | |
|---|---|---|---|---|---|
| ProTrendLines | 134.94 | 153.58 | 157.53 | 160.27 | 161.55 |
| Change (%) | -15.80% | -4.17% | -1.71% | - | +0.80% |
| Change | -25.33 | -6.69 | -2.74 | - | +1.28 |
| Level | Intermediate | Intermediate | Major | - | Intermediate |
Pivot points can also be used to set your price objectives. Here is the price situation in relation to pivot points:
| Pivot points | S3 | S2 | S1 | PP | R1 | R2 | R3 |
|---|---|---|---|---|---|---|---|
| Standard | 156.60 | 159.26 | 160.91 | 163.57 | 165.22 | 167.88 | 169.53 |
| Camarilla | 161.37 | 161.76 | 162.16 | 162.55 | 162.95 | 163.34 | 163.74 |
| Woodie | 156.09 | 159.01 | 160.40 | 163.32 | 164.71 | 167.63 | 169.02 |
| Fibonacci | 159.26 | 160.91 | 161.93 | 163.57 | 165.22 | 166.24 | 167.88 |
| Pivot points | S3 | S2 | S1 | PP | R1 | R2 | R3 |
|---|---|---|---|---|---|---|---|
| Standard | 150.82 | 153.68 | 159.36 | 162.22 | 167.90 | 170.76 | 176.44 |
| Camarilla | 162.69 | 163.47 | 164.26 | 165.04 | 165.82 | 166.61 | 167.39 |
| Woodie | 152.23 | 154.39 | 160.77 | 162.93 | 169.31 | 171.47 | 177.85 |
| Fibonacci | 153.68 | 156.94 | 158.96 | 162.22 | 165.48 | 167.50 | 170.76 |
| Pivot points | S3 | S2 | S1 | PP | R1 | R2 | R3 |
|---|---|---|---|---|---|---|---|
| Standard | 106.16 | 118.65 | 134.28 | 146.77 | 162.40 | 174.89 | 190.52 |
| Camarilla | 142.19 | 144.77 | 147.34 | 149.92 | 152.50 | 155.08 | 157.65 |
| Woodie | 107.74 | 119.44 | 135.86 | 147.56 | 163.98 | 175.68 | 192.10 |
| Fibonacci | 118.65 | 129.39 | 136.03 | 146.77 | 157.51 | 164.15 | 174.89 |
Numerical data
The following is the status of the technical indicators and moving averages at the time of publication of this technical analysis:
| RSI (14): | 58.11 | |
| MACD (12,26,9): | 3.7900 | |
| Directional Movement: | 13.50 | |
| AROON (14): | 92.86 | |
| DEMA (21): | 160.92 | |
| Parabolic SAR (0,02-0,02-0,2): | 166.24 | |
| Elder Ray (13): | 2.38 | |
| Super Trend (3,10): | 151.89 | |
| Zig ZAG (10): | 160.27 | |
| VORTEX (21): | 1.1500 | |
| Stochastique (14,3,5): | 79.50 | |
| TEMA (21): | 164.07 | |
| Williams %R (14): | -35.20 | |
| Chande Momentum Oscillator (20): | 6.37 | |
| Repulse (5,40,3): | -1.0300 | |
| ROCnROLL: | 1 | |
| TRIX (15,9): | 0.2600 | |
| Courbe Coppock: | 19.29 |
| MA7: | 162.55 | |
| MA20: | 154.50 | |
| MA50: | 153.23 | |
| MA100: | 149.19 | |
| MAexp7: | 161.22 | |
| MAexp20: | 156.60 | |
| MAexp50: | 152.77 | |
| MAexp100: | 148.97 | |
| Price / MA7: | -1.40% | |
| Price / MA20: | +3.73% | |
| Price / MA50: | +4.59% | |
| Price / MA100: | +7.43% | |
| Price / MAexp7: | -0.59% | |
| Price / MAexp20: | +2.34% | |
| Price / MAexp50: | +4.91% | |
| Price / MAexp100: | +7.59% |
News
Don"t forget to follow the news on MONOLITHIC POWER SYSTEMS INC.. At the time of publication of this analysis, the latest news was as follows:
- Glancy Prongay & Murray LLP Announces Investigation on Behalf of Monolithic Power Systems, Inc. Investors
- Investor Alert: Kaplan Fox Investigates Monolithic Power Systems, Inc. (Nasdaq: MPWR)
- Bragar Eagel & Squire, P.C. is Investigating Monolithic Power Systems, Inc. (NASDAQ: MPWR) on Behalf of Monolithic Power Stockholders and Encourages Monolithic Power Investors to Contact the Firm
- MPWR SHAREHOLDER ALERT: Hagens Berman Notifies Investors in Monolithic Power Systems (MPWR) of an Investigation Involving Possible Securities Law Violations
- Spruce Point Capital Management Releases A Strong Sell Research Opinion On Monolithic Power Systems, Inc. (Nasdaq: MPWR)
About author

Online


Add a comment
Comments
0 comments on the analysis MONOLITHIC POWER SYSTEMS INC. - Daily