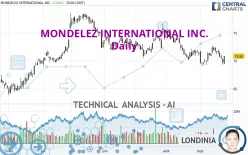
MONDELEZ INTERNATIONAL INC. - Daily - Technical analysis published on 09/26/2023 (GMT)
- 306
- 0
Click here for a new analysis!
- Timeframe : Daily
- - Analysis generated on
- Status : TARGET REACHED

Summary of the analysis

Additional analysis
Quotes
The MONDELEZ INTERNATIONAL INC. price is 70.85 USD. On the day, this instrument gained +1.64% with the lowest point at 69.46 USD and the highest point at 70.87 USD. The deviation from the price is +2.00% for the low point and -0.03% for the high point.So that you have an overall view of the price change, here is a table showing the variations over several periods:
Near a new HIGH record (1 month)
Type : Bullish
Timeframe : Weekly
Technical
A technical analysis in Daily of this MONDELEZ INTERNATIONAL INC. chart shows a sharp bearish trend. 89.29% of the signals given by moving averages are bearish. The overall trend is supported by the strong bearish signals from short-term moving averages. There is no crossing of moving average by the price or crossing of moving averages between themselves.
In fact, Central Analyzer took into account 18 technical indicators and the result was as follows: 8 are bullish, 4 are neutral and 6 are bearish. Caution: the Central Indicators scanner currently detects an excess:
CCI indicator: bullish divergence
Type : Bullish
Timeframe : Daily
MACD indicator: bullish divergence
Type : Bullish
Timeframe : Daily
RSI indicator: bullish divergence
Type : Bullish
Timeframe : Daily
Pivot points : price is over resistance 1
Type : Neutral
Timeframe : Daily
Momentum indicator is back over 0
Type : Bullish
Timeframe : Daily
Central Patterns, the market scanner focusing on chart patterns, resistances and supports found these results:
Near support of channel
Type : Bullish
Timeframe : Daily
Near support of triangle
Type : Bullish
Timeframe : Daily
The presence of a bullish Japanese candlestick pattern detected by Central Candlesticks that could cause a very short term rebound was also detected:
Bullish engulfing lines
Type : Bullish
Timeframe : Daily
| S3 | S2 | S1 | Price | R1 | R2 | R3 | |
|---|---|---|---|---|---|---|---|
| ProTrendLines | 66.03 | 67.28 | 69.54 | 70.85 | 70.89 | 73.51 | 75.35 |
| Change (%) | -6.80% | -5.04% | -1.85% | - | +0.06% | +3.75% | +6.35% |
| Change | -4.82 | -3.57 | -1.31 | - | +0.04 | +2.66 | +4.50 |
| Level | Major | Minor | Major | - | Major | Minor | Major |
Attention could also be paid to pivot points to set price objectives:
| Pivot points | S3 | S2 | S1 | PP | R1 | R2 | R3 |
|---|---|---|---|---|---|---|---|
| Standard | 68.12 | 68.71 | 69.21 | 69.80 | 70.30 | 70.89 | 71.39 |
| Camarilla | 69.41 | 69.51 | 69.61 | 69.71 | 69.81 | 69.91 | 70.01 |
| Woodie | 68.08 | 68.69 | 69.17 | 69.78 | 70.26 | 70.87 | 71.35 |
| Fibonacci | 68.71 | 69.13 | 69.38 | 69.80 | 70.22 | 70.47 | 70.89 |
| Pivot points | S3 | S2 | S1 | PP | R1 | R2 | R3 |
|---|---|---|---|---|---|---|---|
| Standard | 67.68 | 69.01 | 69.72 | 71.05 | 71.76 | 73.09 | 73.80 |
| Camarilla | 69.87 | 70.06 | 70.24 | 70.43 | 70.62 | 70.80 | 70.99 |
| Woodie | 67.37 | 68.86 | 69.41 | 70.90 | 71.45 | 72.94 | 73.49 |
| Fibonacci | 69.01 | 69.79 | 70.27 | 71.05 | 71.83 | 72.31 | 73.09 |
| Pivot points | S3 | S2 | S1 | PP | R1 | R2 | R3 |
|---|---|---|---|---|---|---|---|
| Standard | 63.45 | 66.78 | 69.02 | 72.35 | 74.59 | 77.92 | 80.16 |
| Camarilla | 69.73 | 70.24 | 70.75 | 71.26 | 71.77 | 72.28 | 72.79 |
| Woodie | 62.91 | 66.51 | 68.48 | 72.08 | 74.05 | 77.65 | 79.62 |
| Fibonacci | 66.78 | 68.91 | 70.22 | 72.35 | 74.48 | 75.79 | 77.92 |
Numerical data
The following is the status of technical indicators and moving averages registered at the time this technical analysis was created:
| RSI (14): | 46.70 | |
| MACD (12,26,9): | -0.3200 | |
| Directional Movement: | -6.69 | |
| AROON (14): | 35.71 | |
| DEMA (21): | 70.62 | |
| Parabolic SAR (0,02-0,02-0,2): | 72.63 | |
| Elder Ray (13): | -0.77 | |
| Super Trend (3,10): | 72.41 | |
| Zig ZAG (10): | 70.77 | |
| VORTEX (21): | 0.9100 | |
| Stochastique (14,3,5): | 32.29 | |
| TEMA (21): | 70.69 | |
| Williams %R (14): | -55.35 | |
| Chande Momentum Oscillator (20): | 0.97 | |
| Repulse (5,40,3): | 0.9400 | |
| ROCnROLL: | 2 | |
| TRIX (15,9): | -0.0700 | |
| Courbe Coppock: | 1.33 |
| MA7: | 70.95 | |
| MA20: | 70.89 | |
| MA50: | 72.18 | |
| MA100: | 73.09 | |
| MAexp7: | 70.76 | |
| MAexp20: | 71.08 | |
| MAexp50: | 71.70 | |
| MAexp100: | 71.58 | |
| Price / MA7: | -0.14% | |
| Price / MA20: | -0.06% | |
| Price / MA50: | -1.84% | |
| Price / MA100: | -3.06% | |
| Price / MAexp7: | +0.13% | |
| Price / MAexp20: | -0.32% | |
| Price / MAexp50: | -1.19% | |
| Price / MAexp100: | -1.02% |
News
The latest news and videos published on MONDELEZ INTERNATIONAL INC. at the time of the analysis were as follows:
- Post Consumer Brands and Mondelēz International Introduce Sour Patch Kids® Flavored Cereal
-
 Mondelez Recalls Some Ritz Cracker Products
- TM Capital advises longtime client, Tate's Bake Shop, a portfolio company of The Riverside Company, in its sale to Mondelēz International, Inc. for approximately $500 million
- #MyOreoCreation Contest Finalist Flavor Submissions Hit Shelves Nationwide For Fans To Try And Vote On
- Mondelez International, Inc. Class A to Host Earnings Call
About author
Online


Add a comment
Comments
0 comments on the analysis MONDELEZ INTERNATIONAL INC. - Daily