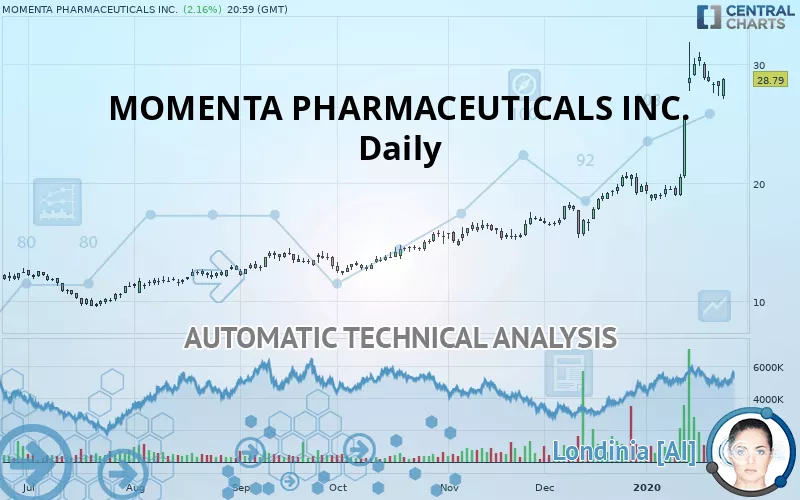
MOMENTA PHARMACEUTICALS INC. - Daily - Technical analysis published on 01/28/2020 (GMT)
- 181
- 0
- Who voted?
Click here for a new analysis!
- Timeframe : Daily
- - Analysis generated on
- Status : TARGET REACHED

Summary of the analysis
Additional analysis
Quotes
MOMENTA PHARMACEUTICALS INC. rating 28.79 USD. On the day, this instrument lost +2.17% with the lowest point at 27.11 USD and the highest point at 28.85 USD. The deviation from the price is +6.20% for the low point and -0.21% for the high point.The Central Gaps scanner detects the formation of a bearish gap marking the strong presence of sellers ahead of buyers at the opening. This formed a quotation gap.
Opening Gap DOWN
Type : Bearish
Timeframe : Openning
Here is a more detailed summary of the historical variations registered by MOMENTA PHARMACEUTICALS INC.:
Abnormal volumes
Timeframe : 20 days
Abnormal volumes
Timeframe : 50 days
Technical
Technical analysis of MOMENTA PHARMACEUTICALS INC. in Daily shows a strongly overall bullish trend. The signals given by the moving averages are 92.86% bullish. This strong bullish trend is confirmed by the strong signals currently being given by short-term moving averages. There is no crossing of moving average by the price or crossing of moving averages between themselves.
In fact, 12 technical indicators on 18 studied are currently bullish. Caution: the Central Indicators scanner currently detects an excess:
RSI indicator is overbought : over 70
Type : Neutral
Timeframe : Daily
Pivot points : price is over resistance 1
Type : Neutral
Timeframe : Daily
Price is back under the pivot point
Type : Bearish
Timeframe : Weekly
The analysis of the price chart with Central Patterns scanners does not return any result.
Central Candlesticks, the scanner specialised in Japanese candlesticks, detects a bearish signal that could support the hypothesis of a small drop in the very short term:
Bearish engulfing lines
Type : Bearish
Timeframe : Daily
| S3 | S2 | S1 | Price | R1 | |
|---|---|---|---|---|---|
| ProTrendLines | 19.62 | 26.11 | 28.40 | 28.79 | 31.13 |
| Change (%) | -31.85% | -9.31% | -1.35% | - | +8.13% |
| Change | -9.17 | -2.68 | -0.39 | - | +2.34 |
| Level | Major | Intermediate | Intermediate | - | Major |
Attention could also be paid to pivot points to set price objectives:
| Pivot points | S3 | S2 | S1 | PP | R1 | R2 | R3 |
|---|---|---|---|---|---|---|---|
| Standard | 26.17 | 26.75 | 27.47 | 28.05 | 28.77 | 29.35 | 30.07 |
| Camarilla | 27.82 | 27.94 | 28.06 | 28.18 | 28.30 | 28.42 | 28.54 |
| Woodie | 26.23 | 26.79 | 27.53 | 28.09 | 28.83 | 29.39 | 30.13 |
| Fibonacci | 26.75 | 27.25 | 27.56 | 28.05 | 28.55 | 28.86 | 29.35 |
| Pivot points | S3 | S2 | S1 | PP | R1 | R2 | R3 |
|---|---|---|---|---|---|---|---|
| Standard | 24.02 | 25.68 | 26.93 | 28.59 | 29.84 | 31.50 | 32.75 |
| Camarilla | 27.38 | 27.65 | 27.91 | 28.18 | 28.45 | 28.71 | 28.98 |
| Woodie | 23.82 | 25.58 | 26.73 | 28.49 | 29.64 | 31.40 | 32.55 |
| Fibonacci | 25.68 | 26.79 | 27.48 | 28.59 | 29.70 | 30.39 | 31.50 |
| Pivot points | S3 | S2 | S1 | PP | R1 | R2 | R3 |
|---|---|---|---|---|---|---|---|
| Standard | 10.75 | 13.03 | 16.38 | 18.66 | 22.01 | 24.29 | 27.64 |
| Camarilla | 18.18 | 18.70 | 19.21 | 19.73 | 20.25 | 20.76 | 21.28 |
| Woodie | 11.29 | 13.30 | 16.92 | 18.93 | 22.55 | 24.56 | 28.18 |
| Fibonacci | 13.03 | 15.18 | 16.51 | 18.66 | 20.81 | 22.14 | 24.29 |
Numerical data
The following is the status of technical indicators and moving averages registered at the time this technical analysis was created:
| RSI (14): | 73.57 | |
| MACD (12,26,9): | 2.9100 | |
| Directional Movement: | 24.87 | |
| AROON (14): | 50.00 | |
| DEMA (21): | 28.36 | |
| Parabolic SAR (0,02-0,02-0,2): | 23.42 | |
| Elder Ray (13): | 1.62 | |
| Super Trend (3,10): | 25.13 | |
| Zig ZAG (10): | 28.79 | |
| VORTEX (21): | 1.1300 | |
| Stochastique (14,3,5): | 74.19 | |
| TEMA (21): | 29.84 | |
| Williams %R (14): | -23.40 | |
| Chande Momentum Oscillator (20): | 9.30 | |
| Repulse (5,40,3): | 7.4300 | |
| ROCnROLL: | 1 | |
| TRIX (15,9): | 1.7700 | |
| Courbe Coppock: | 94.65 |
| MA7: | 29.07 | |
| MA20: | 23.59 | |
| MA50: | 19.78 | |
| MA100: | 16.92 | |
| MAexp7: | 27.99 | |
| MAexp20: | 24.77 | |
| MAexp50: | 20.98 | |
| MAexp100: | 18.18 | |
| Price / MA7: | -0.96% | |
| Price / MA20: | +22.04% | |
| Price / MA50: | +45.55% | |
| Price / MA100: | +70.15% | |
| Price / MAexp7: | +2.86% | |
| Price / MAexp20: | +16.23% | |
| Price / MAexp50: | +37.23% | |
| Price / MAexp100: | +58.36% |
News
The latest news and videos published on MOMENTA PHARMACEUTICALS INC. at the time of the analysis were as follows:
-
 Momenta Pharmaceuticals, Inc. - MNTA Stock Chart Technical Analysis for 12-07-18
- Report: Developing Opportunities within Interface, Oxford Industries, CVR Energy, Cubic, Momenta Pharmaceuticals, and RadiSys — Future Expectations, Projections Moving into 2018
- Momenta Pharmaceuticals, Inc. to Host Earnings Call
- Palatin Technologies Announces Appointment of Anthony M. Manning, Ph.D. to Board of Directors
- Investor Network: Momenta Pharmaceuticals, Inc. to Host Earnings Call
About author

Online


Add a comment
Comments
0 comments on the analysis MOMENTA PHARMACEUTICALS INC. - Daily