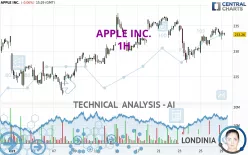
APPLE INC. - 1H - Technical analysis published on 10/29/2024 (GMT)
- 195
- 0
Click here for a new analysis!
- Timeframe : 1H
- - Analysis generated on
- Status : INVALID

Summary of the analysis

Additional analysis
Quotes
APPLE INC. rating 233.28 USD. The price registered a decrease of -0.05% on the session with the lowest point at 232.32 USD and the highest point at 234.07 USD. The deviation from the price is +0.41% for the low point and -0.34% for the high point.The Central Gaps scanner detects a bearish opening marking the presence of sellers ahead of buyers at the opening but not sufficiently marked to allow the price to register a quotation gap.
Bearish opening
Type : Bearish
Timeframe : Openning
A study of price movements over other periods shows the following variations:
Near a new HIGH record (5 years)
Type : Bullish
Timeframe : Weekly
Near a new HIGH record (1 year)
Type : Bullish
Timeframe : Weekly
Near a new HIGH record (1st january)
Type : Bullish
Timeframe : Weekly
Near a new LOW record (1 month)
Type : Bearish
Timeframe : Weekly
Technical
Technical analysis of APPLE INC. in 1H shows a strongly overall bullish trend. 82.14% of the signals given by moving averages are bullish. The slightly bullish signals given by the short-term moving averages indicate this trend is showing signs of running out of steam. The Central Indicators market scanner is currently detecting several bearish signals that could impact this trend:
Bearish trend reversal : Moving Average 50
Type : Bearish
Timeframe : 1 hour
Bearish price crossover with Moving Average 50
Type : Bearish
Timeframe : 1 hour
In fact, according to the parameters integrated into the Central Analyzer system, 11 technical indicators out of 18 analysed are currently bullish. The Central Indicators scanner found no further results concerning independent technical indicators.
Central Patterns, the market scanner focusing on chart patterns, resistances and supports found this result:
Near support of channel
Type : Bullish
Timeframe : 1 hour
The Central Candlesticks scanner, specialised in Japanese candlesticks, did not identify any signals.
| S3 | S2 | S1 | Price | R1 | R2 | |
|---|---|---|---|---|---|---|
| ProTrendLines | 224.02 | 227.84 | 233.03 | 233.28 | 234.55 | 237.49 |
| Change (%) | -3.97% | -2.33% | -0.11% | - | +0.54% | +1.80% |
| Change | -9.26 | -5.44 | -0.25 | - | +1.27 | +4.21 |
| Level | Minor | Intermediate | Intermediate | - | Major | Intermediate |
Pivot points can also be used to set your price objectives. Here is the price situation in relation to pivot points:
| Pivot points | S3 | S2 | S1 | PP | R1 | R2 | R3 |
|---|---|---|---|---|---|---|---|
| Standard | 230.21 | 231.38 | 232.39 | 233.56 | 234.57 | 235.74 | 236.75 |
| Camarilla | 232.80 | 233.00 | 233.20 | 233.40 | 233.60 | 233.80 | 234.00 |
| Woodie | 230.13 | 231.34 | 232.31 | 233.52 | 234.49 | 235.70 | 236.67 |
| Fibonacci | 231.38 | 232.21 | 232.73 | 233.56 | 234.39 | 234.91 | 235.74 |
| Pivot points | S3 | S2 | S1 | PP | R1 | R2 | R3 |
|---|---|---|---|---|---|---|---|
| Standard | 218.07 | 222.92 | 227.16 | 232.01 | 236.25 | 241.10 | 245.34 |
| Camarilla | 228.91 | 229.74 | 230.58 | 231.41 | 232.24 | 233.08 | 233.91 |
| Woodie | 217.78 | 222.77 | 226.87 | 231.86 | 235.96 | 240.95 | 245.05 |
| Fibonacci | 222.92 | 226.39 | 228.53 | 232.01 | 235.48 | 237.62 | 241.10 |
| Pivot points | S3 | S2 | S1 | PP | R1 | R2 | R3 |
|---|---|---|---|---|---|---|---|
| Standard | 201.08 | 207.50 | 220.25 | 226.67 | 239.42 | 245.84 | 258.59 |
| Camarilla | 227.73 | 229.49 | 231.24 | 233.00 | 234.76 | 236.52 | 238.27 |
| Woodie | 204.25 | 209.08 | 223.42 | 228.25 | 242.59 | 247.42 | 261.76 |
| Fibonacci | 207.50 | 214.82 | 219.35 | 226.67 | 233.99 | 238.52 | 245.84 |
Numerical data
The following are the details of the technical indicators and moving averages that were collected to generate this technical analysis:
| RSI (14): | 53.67 | |
| MACD (12,26,9): | 0.4100 | |
| Directional Movement: | 1.61 | |
| AROON (14): | 71.43 | |
| DEMA (21): | 233.14 | |
| Parabolic SAR (0,02-0,02-0,2): | 231.92 | |
| Elder Ray (13): | 0.41 | |
| Super Trend (3,10): | 230.42 | |
| Zig ZAG (10): | 233.40 | |
| VORTEX (21): | 1.0800 | |
| Stochastique (14,3,5): | 83.01 | |
| TEMA (21): | 233.73 | |
| Williams %R (14): | -25.78 | |
| Chande Momentum Oscillator (20): | 0.56 | |
| Repulse (5,40,3): | -0.1700 | |
| ROCnROLL: | 1 | |
| TRIX (15,9): | 0.0000 | |
| Courbe Coppock: | 2.53 |
| MA7: | 233.35 | |
| MA20: | 230.08 | |
| MA50: | 226.95 | |
| MA100: | 222.17 | |
| MAexp7: | 233.51 | |
| MAexp20: | 232.79 | |
| MAexp50: | 232.49 | |
| MAexp100: | 231.39 | |
| Price / MA7: | -0.03% | |
| Price / MA20: | +1.39% | |
| Price / MA50: | +2.79% | |
| Price / MA100: | +5.00% | |
| Price / MAexp7: | -0.10% | |
| Price / MAexp20: | +0.21% | |
| Price / MAexp50: | +0.34% | |
| Price / MAexp100: | +0.82% |
News
The last news published on APPLE INC. at the time of the generation of this analysis was as follows:
- Summary Notice of Pendency and Proposed Settlement of Shareholder Derivative Actions
-
 Apple $32 Fined Million For Infringing Qualcomm Patents
-
Apple Infringed Three Qualcomm Patents
- Qualcomm Wins Patent Infringement Case Against Apple in San Diego
-
Apple Is Holding A Big Event This Month
About author
Online


Add a comment
Comments
0 comments on the analysis APPLE INC. - 1H