APPLE INC. - Daily - Technical analysis published on 10/10/2024 (GMT)
- 228
- 0
Click here for a new analysis!
- Timeframe : Daily
- - Analysis generated on
- Status : TARGET REACHED

Summary of the analysis

Additional analysis
Quotes
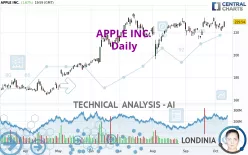
The APPLE INC. rating is 229.54 USD. The price registered an increase of +1.67% on the session and was between 224.83 USD and 229.75 USD. This implies that the price is at +2.09% from its lowest and at -0.09% from its highest.A bearish opening was detected by the Central Gaps scanner. Sellers are trying to impose a bearish trend in the very short term.
Bearish opening
Type : Bearish
Timeframe : Openning
A study of price movements over other periods shows the following variations:
Near a new HIGH record (5 years)
Type : Bullish
Timeframe : Weekly
Near a new HIGH record (1 year)
Type : Bullish
Timeframe : Weekly
Near a new HIGH record (1st january)
Type : Bullish
Timeframe : Weekly
Near a new LOW record (1 month)
Type : Bearish
Timeframe : Weekly
Technical
Technical analysis of this Daily chart of APPLE INC. indicates that the overall trend is strongly bullish. 92.86% of the signals given by moving averages are bullish. The overall trend is supported by the strong bullish signals from short-term moving averages. There is no crossing of moving average by the price or crossing of moving averages between themselves.
The probability of a further increase is slight given the direction of the technical indicators.
Central Indicators, the detector scanner for these technical indicators has recently detected several signals:
Pivot points : price is over resistance 3
Type : Neutral
Timeframe : Daily
Aroon indicator bearish trend
Type : Bearish
Timeframe : Daily
Price is back over the pivot point
Type : Bullish
Timeframe : Weekly
Momentum indicator is back over 0
Type : Bullish
Timeframe : Daily
Williams %R indicator is back over -50
Type : Bullish
Timeframe : Daily
Central Patterns, the market scanner focusing on chart patterns, resistances and supports found this result:
Near horizontal resistance
Type : Bearish
Timeframe : Daily
No result was found by the Central Candlesticks scanner on Japanese candlesticks.
| S3 | S2 | S1 | Price | R1 | |
|---|---|---|---|---|---|
| ProTrendLines | 194.44 | 206.99 | 216.34 | 229.54 | 234.55 |
| Change (%) | -15.29% | -9.82% | -5.75% | - | +2.18% |
| Change | -35.10 | -22.55 | -13.20 | - | +5.01 |
| Level | Minor | Intermediate | Major | - | Major |
Pivot points can also be used to set your price objectives. Here is the price situation in relation to pivot points:
| Pivot points | S3 | S2 | S1 | PP | R1 | R2 | R3 |
|---|---|---|---|---|---|---|---|
| Standard | 221.41 | 223.12 | 226.33 | 228.04 | 231.25 | 232.96 | 236.17 |
| Camarilla | 228.19 | 228.64 | 229.09 | 229.54 | 229.99 | 230.44 | 230.89 |
| Woodie | 222.16 | 223.50 | 227.08 | 228.42 | 232.00 | 233.34 | 236.92 |
| Fibonacci | 223.12 | 225.00 | 226.16 | 228.04 | 229.92 | 231.08 | 232.96 |
| Pivot points | S3 | S2 | S1 | PP | R1 | R2 | R3 |
|---|---|---|---|---|---|---|---|
| Standard | 212.23 | 217.63 | 222.21 | 227.61 | 232.19 | 237.59 | 242.17 |
| Camarilla | 224.06 | 224.97 | 225.89 | 226.80 | 227.72 | 228.63 | 229.55 |
| Woodie | 211.83 | 217.43 | 221.81 | 227.41 | 231.79 | 237.39 | 241.77 |
| Fibonacci | 217.63 | 221.44 | 223.79 | 227.61 | 231.42 | 233.77 | 237.59 |
| Pivot points | S3 | S2 | S1 | PP | R1 | R2 | R3 |
|---|---|---|---|---|---|---|---|
| Standard | 201.08 | 207.50 | 220.25 | 226.67 | 239.42 | 245.84 | 258.59 |
| Camarilla | 227.73 | 229.49 | 231.24 | 233.00 | 234.76 | 236.52 | 238.27 |
| Woodie | 204.25 | 209.08 | 223.42 | 228.25 | 242.59 | 247.42 | 261.76 |
| Fibonacci | 207.50 | 214.82 | 219.35 | 226.67 | 233.99 | 238.52 | 245.84 |
Numerical data
The following are the details of the technical indicators and moving averages that were collected to generate this technical analysis:
| RSI (14): | 56.37 | |
| MACD (12,26,9): | 1.0400 | |
| Directional Movement: | 4.16 | |
| AROON (14): | -78.57 | |
| DEMA (21): | 227.17 | |
| Parabolic SAR (0,02-0,02-0,2): | 221.33 | |
| Elder Ray (13): | 1.02 | |
| Super Trend (3,10): | 217.95 | |
| Zig ZAG (10): | 229.54 | |
| VORTEX (21): | 1.0000 | |
| Stochastique (14,3,5): | 44.75 | |
| TEMA (21): | 227.10 | |
| Williams %R (14): | -30.19 | |
| Chande Momentum Oscillator (20): | 3.07 | |
| Repulse (5,40,3): | 2.7200 | |
| ROCnROLL: | 1 | |
| TRIX (15,9): | 0.0700 | |
| Courbe Coppock: | 3.27 |
| MA7: | 226.07 | |
| MA20: | 225.36 | |
| MA50: | 223.08 | |
| MA100: | 216.85 | |
| MAexp7: | 226.63 | |
| MAexp20: | 225.76 | |
| MAexp50: | 222.79 | |
| MAexp100: | 215.38 | |
| Price / MA7: | +1.53% | |
| Price / MA20: | +1.85% | |
| Price / MA50: | +2.90% | |
| Price / MA100: | +5.85% | |
| Price / MAexp7: | +1.28% | |
| Price / MAexp20: | +1.67% | |
| Price / MAexp50: | +3.03% | |
| Price / MAexp100: | +6.57% |
News
Don't forget to follow the news on APPLE INC.. At the time of publication of this analysis, the latest news was as follows:
- Summary Notice of Pendency and Proposed Settlement of Shareholder Derivative Actions
-
 Apple $32 Fined Million For Infringing Qualcomm Patents
-
Apple Infringed Three Qualcomm Patents
- Qualcomm Wins Patent Infringement Case Against Apple in San Diego
-
Apple Is Holding A Big Event This Month
About author

Online


Add a comment
Comments
0 comments on the analysis APPLE INC. - Daily