APPLE INC. - 1H - Technical analysis published on 10/09/2024 (GMT)
- 127
- 0
Click here for a new analysis!
- Timeframe : 1H
- - Analysis generated on
- Status : INVALID
Summary of the analysis

Additional analysis
Quotes
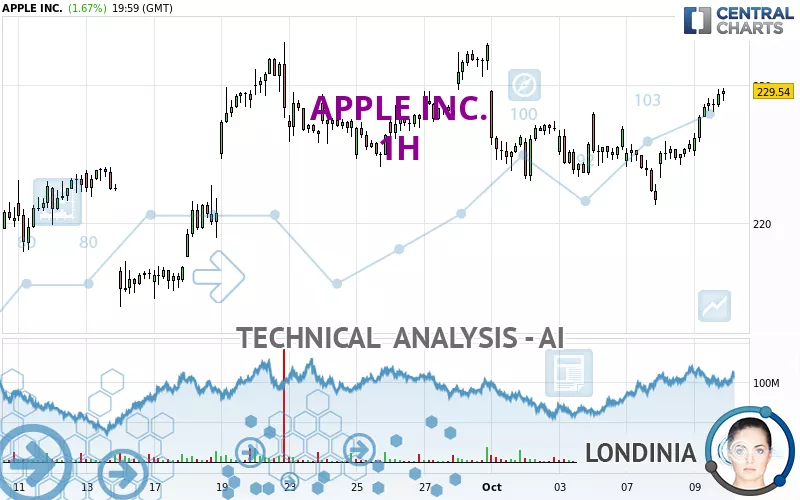
APPLE INC. rating 229.54 USD. On the day, this instrument gained +1.67% and was traded between 224.83 USD and 229.75 USD over the period. The price is currently at +2.09% from its lowest and -0.09% from its highest.A bearish opening was detected by the Central Gaps scanner. Sellers are trying to impose a bearish trend in the very short term.
Bearish opening
Type : Bearish
Timeframe : Openning
Here is a more detailed summary of the historical variations registered by APPLE INC.:
Near a new HIGH record (5 years)
Type : Bullish
Timeframe : Weekly
Near a new HIGH record (1 year)
Type : Bullish
Timeframe : Weekly
Near a new HIGH record (1st january)
Type : Bullish
Timeframe : Weekly
Near a new LOW record (1 month)
Type : Bearish
Timeframe : Weekly
Technical
Technical analysis of this 1H chart of APPLE INC. indicates that the overall trend is bullish. 78.57% of the signals given by moving averages are bullish. The overall trend is reinforced by the strong bullish signals from short-term moving averages. An assessment of moving averages reveals a bullish signal that could impact this trend:
Moving Average bullish crossovers : MA20 & MA50
Type : Bullish
Timeframe : 1 hour
In fact, 16 technical indicators on 18 studied are currently bullish. Caution: the Central Indicators scanner currently detects an excess:
CCI indicator is overbought : over 100
Type : Neutral
Timeframe : 1 hour
CCI indicator: bearish divergence
Type : Bearish
Timeframe : 1 hour
Williams %R indicator is overbought : over -20
Type : Neutral
Timeframe : 1 hour
Pivot points : price is over resistance 3
Type : Neutral
Timeframe : 1 hour
Price is back over the pivot point
Type : Bullish
Timeframe : Weekly
An analysis of the price chart with the Central Patterns scanner (detector of chart patterns and resistances and supports) shows several results that can have an impact on the price change:
Near horizontal resistance
Type : Bearish
Timeframe : 1 hour
Resistance of channel is broken
Type : Bullish
Timeframe : 1 hour
The Central Candlesticks scanner, specialised in Japanese candlesticks, did not identify any signals.
| S3 | S2 | S1 | Price | R1 | R2 | R3 | |
|---|---|---|---|---|---|---|---|
| ProTrendLines | 224.03 | 225.92 | 228.03 | 229.54 | 229.84 | 233.03 | 234.55 |
| Change (%) | -2.40% | -1.58% | -0.66% | - | +0.13% | +1.52% | +2.18% |
| Change | -5.51 | -3.62 | -1.51 | - | +0.30 | +3.49 | +5.01 |
| Level | Intermediate | Minor | Intermediate | - | Minor | Major | Major |
To determine price objectives, it is also possible to use the pivot points. Here is the price position in relation to pivot points:
| Pivot points | S3 | S2 | S1 | PP | R1 | R2 | R3 |
|---|---|---|---|---|---|---|---|
| Standard | 221.41 | 223.12 | 226.33 | 228.04 | 231.25 | 232.96 | 236.17 |
| Camarilla | 228.19 | 228.64 | 229.09 | 229.54 | 229.99 | 230.44 | 230.89 |
| Woodie | 222.16 | 223.50 | 227.08 | 228.42 | 232.00 | 233.34 | 236.92 |
| Fibonacci | 223.12 | 225.00 | 226.16 | 228.04 | 229.92 | 231.08 | 232.96 |
| Pivot points | S3 | S2 | S1 | PP | R1 | R2 | R3 |
|---|---|---|---|---|---|---|---|
| Standard | 212.23 | 217.63 | 222.21 | 227.61 | 232.19 | 237.59 | 242.17 |
| Camarilla | 224.06 | 224.97 | 225.89 | 226.80 | 227.72 | 228.63 | 229.55 |
| Woodie | 211.83 | 217.43 | 221.81 | 227.41 | 231.79 | 237.39 | 241.77 |
| Fibonacci | 217.63 | 221.44 | 223.79 | 227.61 | 231.42 | 233.77 | 237.59 |
| Pivot points | S3 | S2 | S1 | PP | R1 | R2 | R3 |
|---|---|---|---|---|---|---|---|
| Standard | 201.08 | 207.50 | 220.25 | 226.67 | 239.42 | 245.84 | 258.59 |
| Camarilla | 227.73 | 229.49 | 231.24 | 233.00 | 234.76 | 236.52 | 238.27 |
| Woodie | 204.25 | 209.08 | 223.42 | 228.25 | 242.59 | 247.42 | 261.76 |
| Fibonacci | 207.50 | 214.82 | 219.35 | 226.67 | 233.99 | 238.52 | 245.84 |
Numerical data
The following is the status of technical indicators and moving averages registered at the time this technical analysis was created:
| RSI (14): | 67.80 | |
| MACD (12,26,9): | 0.9900 | |
| Directional Movement: | 18.38 | |
| AROON (14): | 100.00 | |
| DEMA (21): | 227.72 | |
| Parabolic SAR (0,02-0,02-0,2): | 225.10 | |
| Elder Ray (13): | 1.90 | |
| Super Trend (3,10): | 225.53 | |
| Zig ZAG (10): | 229.56 | |
| VORTEX (21): | 1.0200 | |
| Stochastique (14,3,5): | 95.58 | |
| TEMA (21): | 228.86 | |
| Williams %R (14): | -1.87 | |
| Chande Momentum Oscillator (20): | 4.52 | |
| Repulse (5,40,3): | 0.8000 | |
| ROCnROLL: | 1 | |
| TRIX (15,9): | 0.0200 | |
| Courbe Coppock: | 3.82 |
| MA7: | 226.09 | |
| MA20: | 225.35 | |
| MA50: | 223.08 | |
| MA100: | 216.85 | |
| MAexp7: | 228.35 | |
| MAexp20: | 226.73 | |
| MAexp50: | 226.22 | |
| MAexp100: | 225.94 | |
| Price / MA7: | +1.53% | |
| Price / MA20: | +1.86% | |
| Price / MA50: | +2.90% | |
| Price / MA100: | +5.85% | |
| Price / MAexp7: | +0.52% | |
| Price / MAexp20: | +1.24% | |
| Price / MAexp50: | +1.47% | |
| Price / MAexp100: | +1.59% |
News
The latest news and videos published on APPLE INC. at the time of the analysis were as follows:
- Summary Notice of Pendency and Proposed Settlement of Shareholder Derivative Actions
-
 Apple $32 Fined Million For Infringing Qualcomm Patents
-
Apple Infringed Three Qualcomm Patents
- Qualcomm Wins Patent Infringement Case Against Apple in San Diego
-
Apple Is Holding A Big Event This Month
About author

Online


Add a comment
Comments
0 comments on the analysis APPLE INC. - 1H