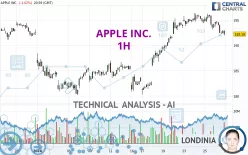
APPLE INC. - 1H - Technical analysis published on 01/29/2024 (GMT)
- 206
- 0
- Timeframe : 1H
- - Analysis generated on
- Status : NEUTRAL

Summary of the analysis

Additional analysis
Quotes
APPLE INC. rating 192.42 USD. The price registered a decrease of -0.90% on the session with the lowest point at 191.94 USD and the highest point at 194.76 USD. The deviation from the price is +0.25% for the low point and -1.20% for the high point.The Central Gaps scanner detects a bullish opening marking the presence of buyers ahead of sellers at the opening but not sufficiently marked to allow the price to register a quotation gap.
Bullish opening
Type : Bullish
Timeframe : Openning
So that you have an overall view of the price change, here is a table showing the variations over several periods:
Near a new HIGH record (5 years)
Type : Bullish
Timeframe : Weekly
Near a new HIGH record (1 year)
Type : Bullish
Timeframe : Weekly
Near a new HIGH record (1st january)
Type : Bullish
Timeframe : Weekly
Near a new HIGH record (1 month)
Type : Bullish
Timeframe : Weekly
Technical
A technical analysis in 1H of this APPLE INC. chart shows a slightly bullish trend. Only 60.71% of the signals given by moving averages are bullish. This slightly bullish trend could turn neutral or reverse given the slightly bearish signals currently being given by short-term moving averages. The Central Indicators scanner detects a bearish signal on moving averages that could impact this trend:
Bearish price crossover with Moving Average 50
Type : Bearish
Timeframe : 1 hour
In fact, 11 technical indicators on 18 studied are currently bearish. But beware of excesses. The Central Indicators scanner currently detects this:
CCI indicator is oversold : under -100
Type : Neutral
Timeframe : 1 hour
Williams %R indicator is oversold : under -80
Type : Neutral
Timeframe : 1 hour
Pivot points : price is under support 1
Type : Neutral
Timeframe : 1 hour
MACD indicator is back under 0
Type : Bearish
Timeframe : 1 hour
The Central Patterns scanner, which studies chart patterns, resistances and supports, has identified this signal:
Near support of channel
Type : Bullish
Timeframe : 1 hour
For a small setback in the very short term, the Central Candlesticks scanner currently notes the presence of this bearish pattern in Japanese candlesticks:
Bearish engulfing lines
Type : Bearish
Timeframe : 1 hour
| S3 | S2 | S1 | Price | R1 | R2 | |
|---|---|---|---|---|---|---|
| ProTrendLines | 187.05 | 189.42 | 191.09 | 192.42 | 193.12 | 195.93 |
| Change (%) | -2.79% | -1.56% | -0.69% | - | +0.36% | +1.82% |
| Change | -5.37 | -3.00 | -1.33 | - | +0.70 | +3.51 |
| Level | Minor | Minor | Minor | - | Minor | Major |
To determine price objectives, it is also possible to use the pivot points. Here is the price position in relation to pivot points:
| Pivot points | S3 | S2 | S1 | PP | R1 | R2 | R3 |
|---|---|---|---|---|---|---|---|
| Standard | 188.50 | 190.22 | 191.32 | 193.04 | 194.14 | 195.86 | 196.96 |
| Camarilla | 191.65 | 191.90 | 192.16 | 192.42 | 192.68 | 192.94 | 193.20 |
| Woodie | 188.19 | 190.07 | 191.01 | 192.89 | 193.83 | 195.71 | 196.65 |
| Fibonacci | 190.22 | 191.30 | 191.96 | 193.04 | 194.12 | 194.78 | 195.86 |
| Pivot points | S3 | S2 | S1 | PP | R1 | R2 | R3 |
|---|---|---|---|---|---|---|---|
| Standard | 186.34 | 189.14 | 190.78 | 193.58 | 195.22 | 198.02 | 199.66 |
| Camarilla | 191.20 | 191.61 | 192.01 | 192.42 | 192.83 | 193.23 | 193.64 |
| Woodie | 185.76 | 188.85 | 190.20 | 193.29 | 194.64 | 197.73 | 199.08 |
| Fibonacci | 189.14 | 190.84 | 191.88 | 193.58 | 195.28 | 196.32 | 198.02 |
| Pivot points | S3 | S2 | S1 | PP | R1 | R2 | R3 |
|---|---|---|---|---|---|---|---|
| Standard | 174.61 | 181.03 | 186.78 | 193.20 | 198.95 | 205.37 | 211.12 |
| Camarilla | 189.18 | 190.30 | 191.41 | 192.53 | 193.65 | 194.76 | 195.88 |
| Woodie | 174.28 | 180.86 | 186.45 | 193.03 | 198.62 | 205.20 | 210.79 |
| Fibonacci | 181.03 | 185.68 | 188.55 | 193.20 | 197.85 | 200.72 | 205.37 |
Numerical data
The following is the status of technical indicators and moving averages registered at the time this technical analysis was created:
| RSI (14): | 39.90 | |
| MACD (12,26,9): | -0.1000 | |
| Directional Movement: | -11.83 | |
| AROON (14): | -78.57 | |
| DEMA (21): | 193.99 | |
| Parabolic SAR (0,02-0,02-0,2): | 195.04 | |
| Elder Ray (13): | -1.17 | |
| Super Trend (3,10): | 195.21 | |
| Zig ZAG (10): | 192.19 | |
| VORTEX (21): | 0.8600 | |
| Stochastique (14,3,5): | 8.76 | |
| TEMA (21): | 192.76 | |
| Williams %R (14): | -94.23 | |
| Chande Momentum Oscillator (20): | -3.28 | |
| Repulse (5,40,3): | -0.6000 | |
| ROCnROLL: | -1 | |
| TRIX (15,9): | 0.0300 | |
| Courbe Coppock: | 2.16 |
| MA7: | 192.91 | |
| MA20: | 188.21 | |
| MA50: | 190.84 | |
| MA100: | 183.50 | |
| MAexp7: | 193.10 | |
| MAexp20: | 193.79 | |
| MAexp50: | 192.38 | |
| MAexp100: | 190.65 | |
| Price / MA7: | -0.25% | |
| Price / MA20: | +2.24% | |
| Price / MA50: | +0.83% | |
| Price / MA100: | +4.86% | |
| Price / MAexp7: | -0.47% | |
| Price / MAexp20: | -0.83% | |
| Price / MAexp50: | -0.10% | |
| Price / MAexp100: | +0.81% |
News
The latest news and videos published on APPLE INC. at the time of the analysis were as follows:
-
 Apple $32 Fined Million For Infringing Qualcomm Patents
-
Apple Infringed Three Qualcomm Patents
- Qualcomm Wins Patent Infringement Case Against Apple in San Diego
-
Apple Is Holding A Big Event This Month
-
Spotify Vs Apple
About author

Online


Add a comment
Comments
0 comments on the analysis APPLE INC. - 1H